先介紹一下如何獲取一下china.json文件:阿里雲-DataDv數據可視化平台
也可以自己訪問鏈接:https://datav.aliyun.com/portal/school/atlas/area_selector
聲明:我是vue3項目,根據自己的情況而定
引入:
<template>
  <div id="mapArea"
       ref="chinaChart" />
</template>
<script setup>
import { onMounted, ref } from 'vue'
import chinaJson from '@/data/china.json'
import * as echarts from 'echarts'

const handleMap = function () {
  let myChart = echarts.init(document.getElementById('mapArea'))
  echarts.registerMap('china', chinaJson)
  const options = {
    tooltip: {
      trigger: 'item',
    },
    geo: {
      map: 'china',
      nameMap: '中國',
      roam: false,
      scaleLimit: {
        min: 1,
        max: 2,
      },
      zoom: 1.2,
      itemStyle: {
        areaColor: '#e5eeff',
        borderColor: '#1a53ff',
      },
      emphasis: {
        itemStyle: {
          areaColor: '#f8734f',
        },
        label: {
          show: false,
        },
      },
      select: {
         itemStyle: {
           areaColor: '#1a53fe',
         },
       },
      tooltip: {
        show: true,
      },
       selectedMode: 'single',
      label: {
        show: false,
        color: '#333',
        align: 'center',
        fontSize: 10,
      },

      regions: [
        {
          name: '河南省',
          itemStyle: {
            areaColor: '#a3c1ff',
          },
        },
      ],
    },
  }
  myChart.setOption(options)
}
onMounted(() => {
  handleMap()
})
</script>
我只是為了讓地圖顯示,不是為了實現每個數據多少,其他的你們根據情況用geo?還是series?
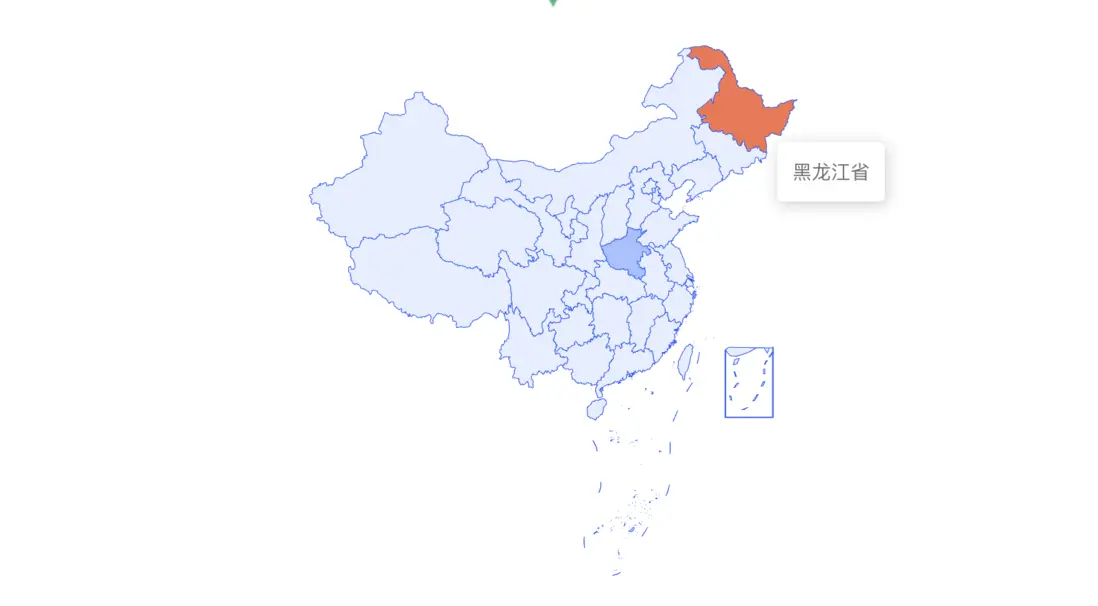
效果圖如下:


