
目錄
第二篇完成度
Mock模擬數據
源碼:
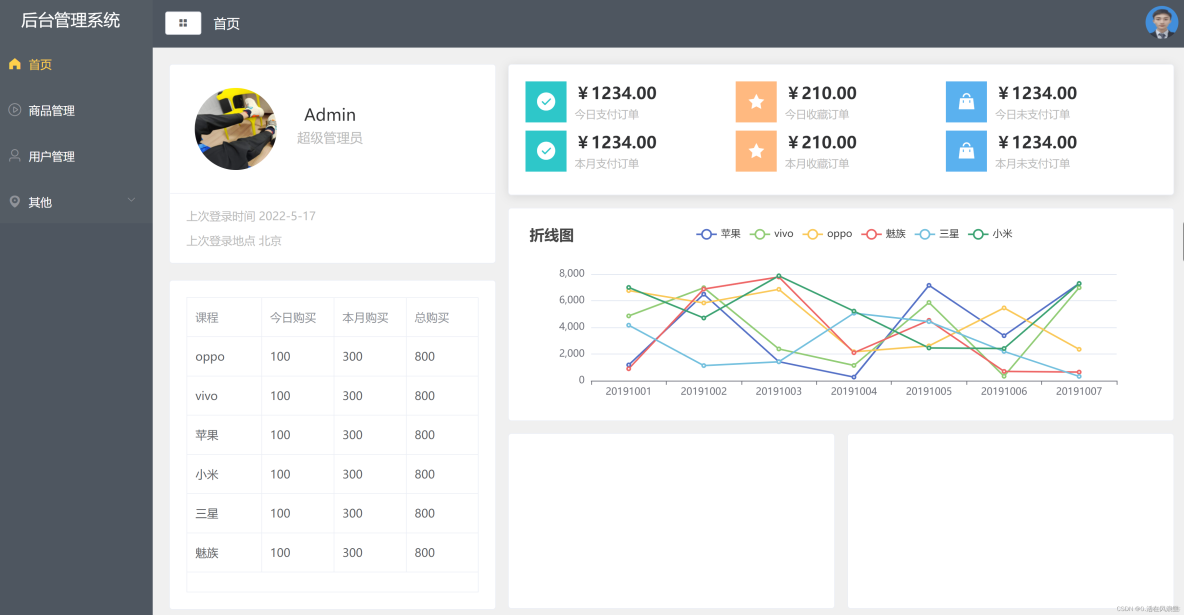
折線圖
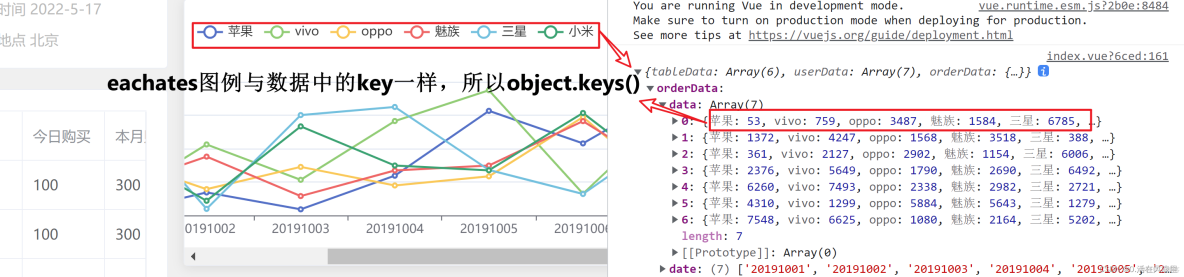
圖例
X軸
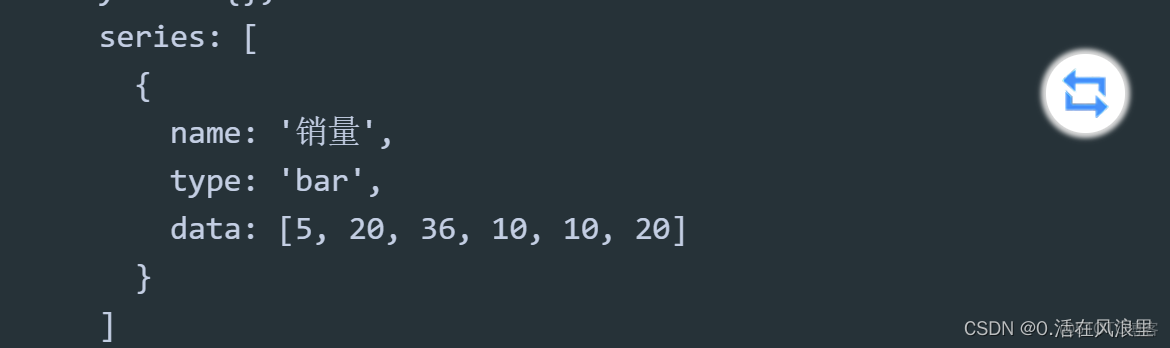
series配置數據
源碼
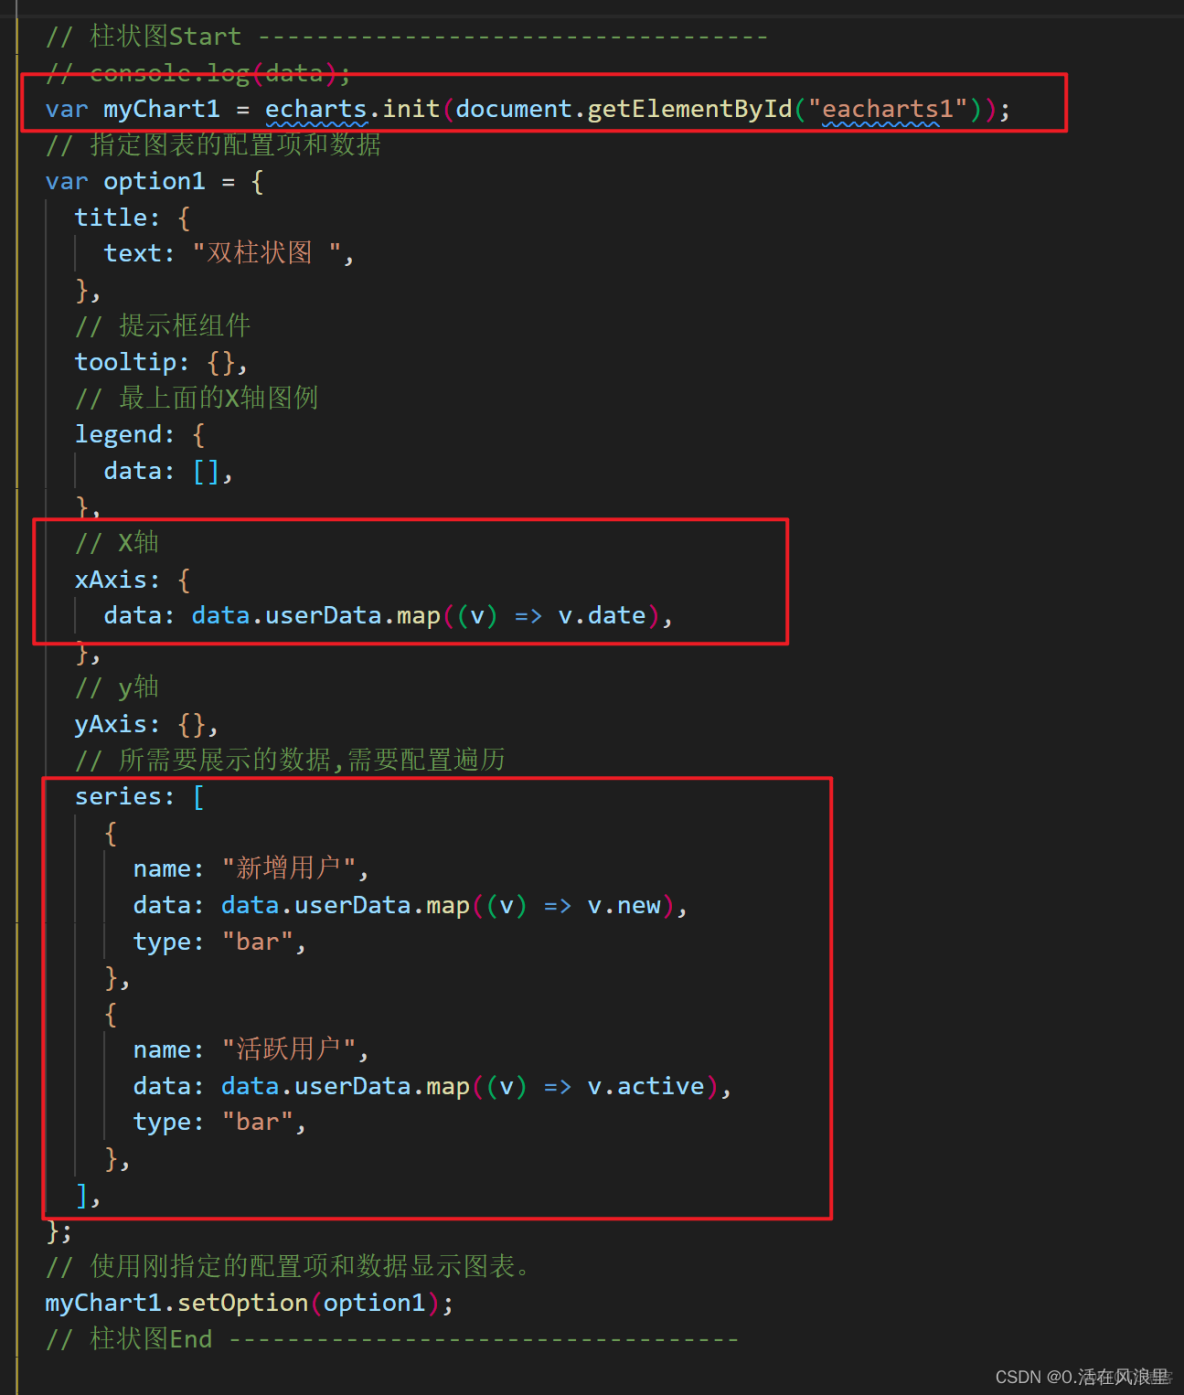
柱狀圖
template
js mounted
餅圖
template
js mounted
完整效果
第二篇完成度

- 接下來模擬數據寫圖表
- 使用 Mock可以模擬真實 API 返回,相對一大堆的官方解釋,大概率要馬冬梅,推薦一篇極簡mock使用教程,官方文檔自己百度下都有
- Mock的簡單使用點擊查看詳情
Mock模擬數據


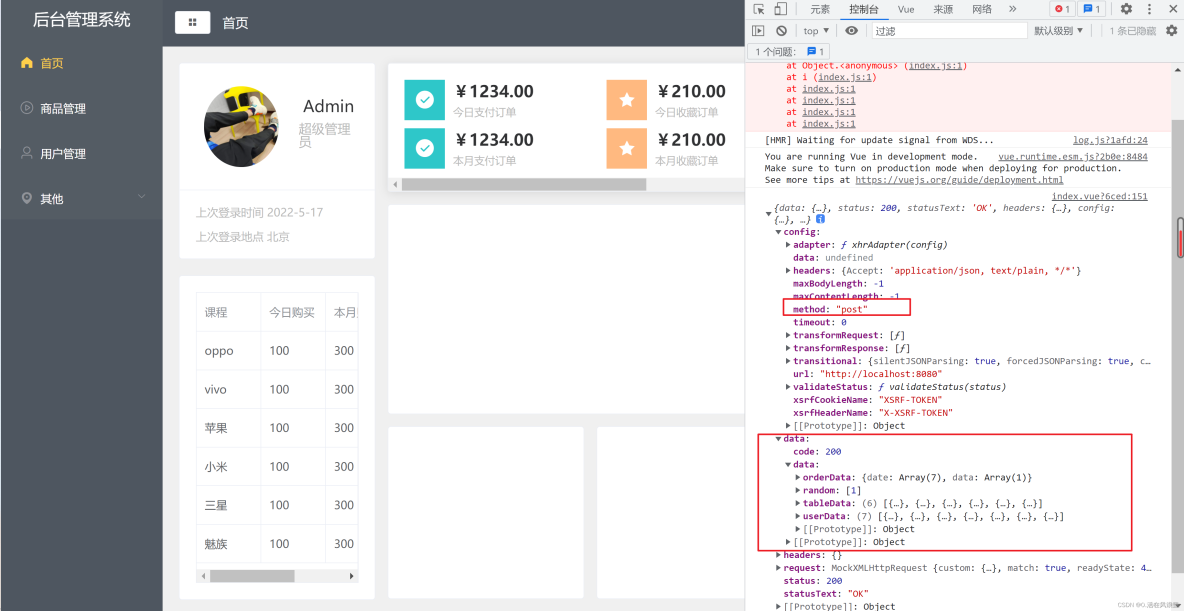
頁面響應的數據
源碼:
位置:src/mock.js
import Mock from "mockjs";
let url = "http://localhost:8080";
let list = [];
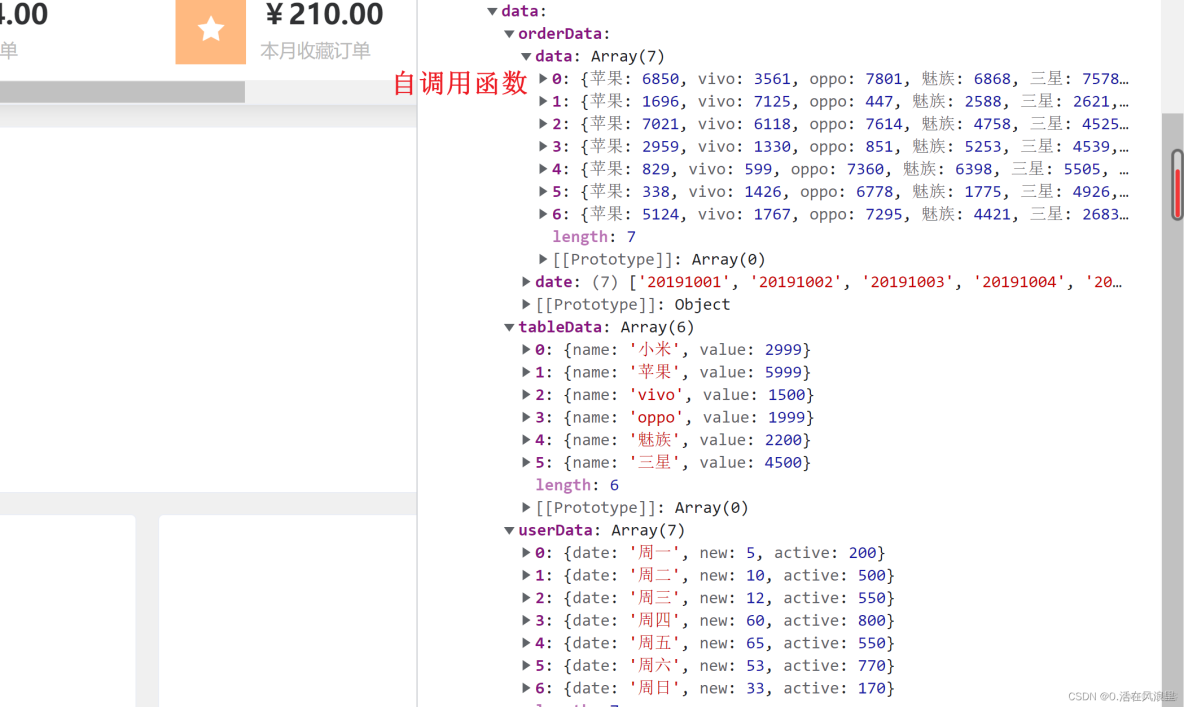
// 自調用函數
(function() {
for (let i = 0; i < 7; i++) {
list.push({
蘋果: Math.round(Math.random() * (10, 8000)),
vivo: Math.round(Math.random() * (10, 8000)),
oppo: Math.round(Math.random() * (10, 8000)),
魅族: Math.round(Math.random() * (10, 8000)),
三星: Math.round(Math.random() * (10, 8000)),
小米: Math.round(Math.random() * (10, 8000))
})
}
}())
// 或 命名函數手動調用
// fn();
// function fn() {
// for (let i = 0; i < 7; i++) {
// list.push({
// 蘋果: Math.round(Math.random() * (10, 8000)),
// vivo: Math.round(Math.random() * (10, 8000)),
// oppo: Math.round(Math.random() * (10, 8000)),
// 魅族: Math.round(Math.random() * (10, 8000)),
// 三星: Math.round(Math.random() * (10, 8000)),
// 小米: Math.round(Math.random() * (10, 8000))
// })
// }
// }
Mock.mock(url, "post", {
code: 200,
data: {
// 表格數據
tableData: [{
name: "oppo",
todayBuy: 500,
monthBuy: 3500,
totalBuy: 22000,
},
{
name: "vivo",
todayBuy: 300,
monthBuy: 2200,
totalBuy: 24000,
},
{
name: "蘋果",
todayBuy: 800,
monthBuy: 4500,
totalBuy: 65000,
},
{
name: "小米",
todayBuy: 1200,
monthBuy: 6500,
totalBuy: 45000,
},
{
name: "三星",
todayBuy: 300,
monthBuy: 2000,
totalBuy: 34000,
},
{
name: "魅族",
todayBuy: 350,
monthBuy: 3000,
totalBuy: 22000,
},
],
// 餅圖
tableData: [{
name: "小米",
value: 2999,
},
{
name: "蘋果",
value: 5999,
},
{
name: "vivo",
value: 1500,
},
{
name: "oppo",
value: 1999,
},
{
name: "魅族",
value: 2200,
},
{
name: "三星",
value: 4500,
},
],
// 柱狀圖
userData: [{
date: "週一",
new: 5,
active: 200,
},
{
date: "週二",
new: 10,
active: 500,
},
{
date: "週三",
new: 12,
active: 550,
},
{
date: "週四",
new: 60,
active: 800,
},
{
date: "週五",
new: 65,
active: 550,
},
{
date: "週六",
new: 53,
active: 770,
},
{
date: "週日",
new: 33,
active: 170,
},
],
// 折線圖
orderData: {
date: [
"20191001",
"20191002",
"20191003",
"20191004",
"20191005",
"20191006",
"20191007",
],
data: list,
},
},
});
export default url;
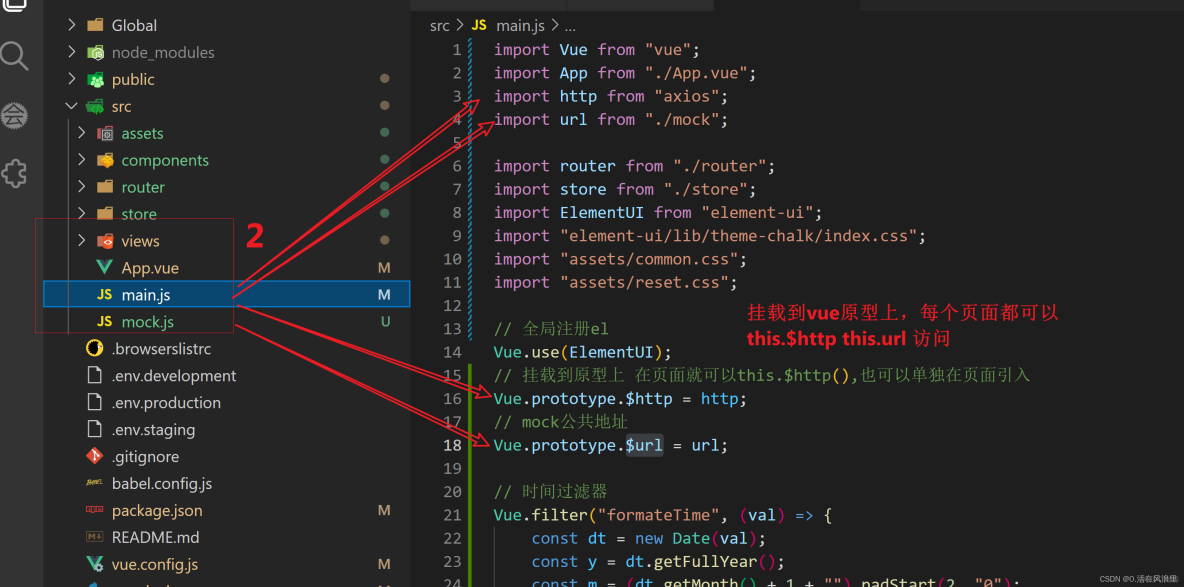
位置:src/main.js
import Vue from "vue";
import App from "./App.vue";
import http from "axios";
import url from "./mock";

import router from "./router";
import store from "./store";
import ElementUI from "element-ui";
import "element-ui/lib/theme-chalk/index.css";
import "assets/common.css";
import "assets/reset.css";

// 全局註冊el
Vue.use(ElementUI);
// 掛載到原型上 在頁面就可以this.$http(),也可以單獨在頁面引入
Vue.prototype.$http = http;
// mock公共地址
Vue.prototype.$url = url;

// 時間過濾器
Vue.filter("formateTime", (val) => {
    const dt = new Date(val);
    const y = dt.getFullYear();
    const m = (dt.getMonth() + 1 + "").padStart(2, "0");
    const d = (dt.getDate() + "").padStart(2, "0");
    const hh = (dt.getHours() + "").padStart(2, "0");
    const mm = (dt.getMinutes() + "").padStart(2, "0");
    const ss = (dt.getSeconds() + "").padStart(2, "0");
    // yyyy-mm-dd hh:mm:ss
    return `${y}-${m}-${d} ${hh}:${mm}:${ss}`;
});

//使用過濾器就會保留兩位小數 在頁面使用 {{price| formatePrice}}
Vue.filter("formatePrice", (val) => {
    //console.log(val) // 過濾的數據
    return val.toFixed(2);
});

new Vue({
    router,
    store,
    render: (h) => h(App),
}).$mount("#app");
折線圖
- echarts實例需要獲取dom,所以需要在mounted中初始化
圖例
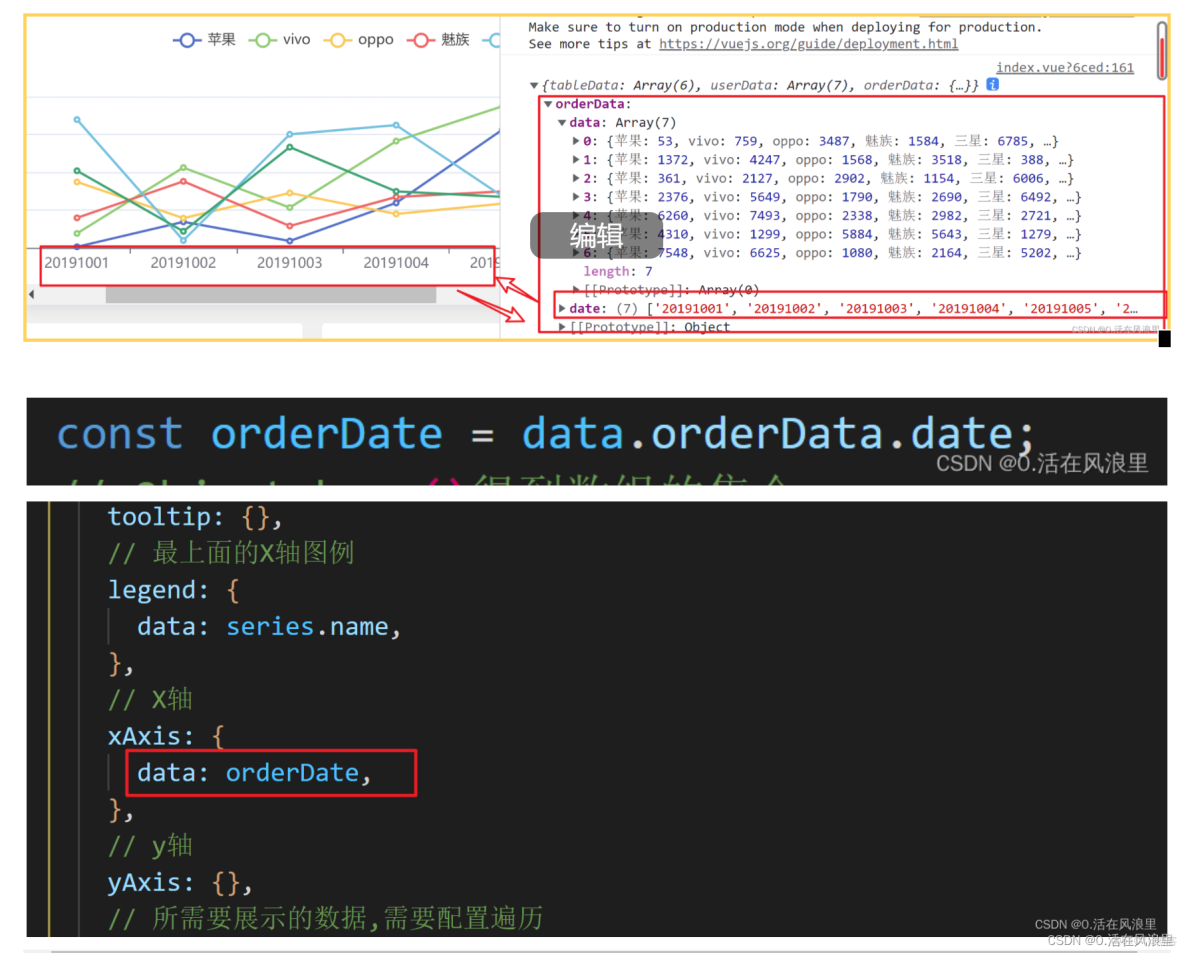
X軸
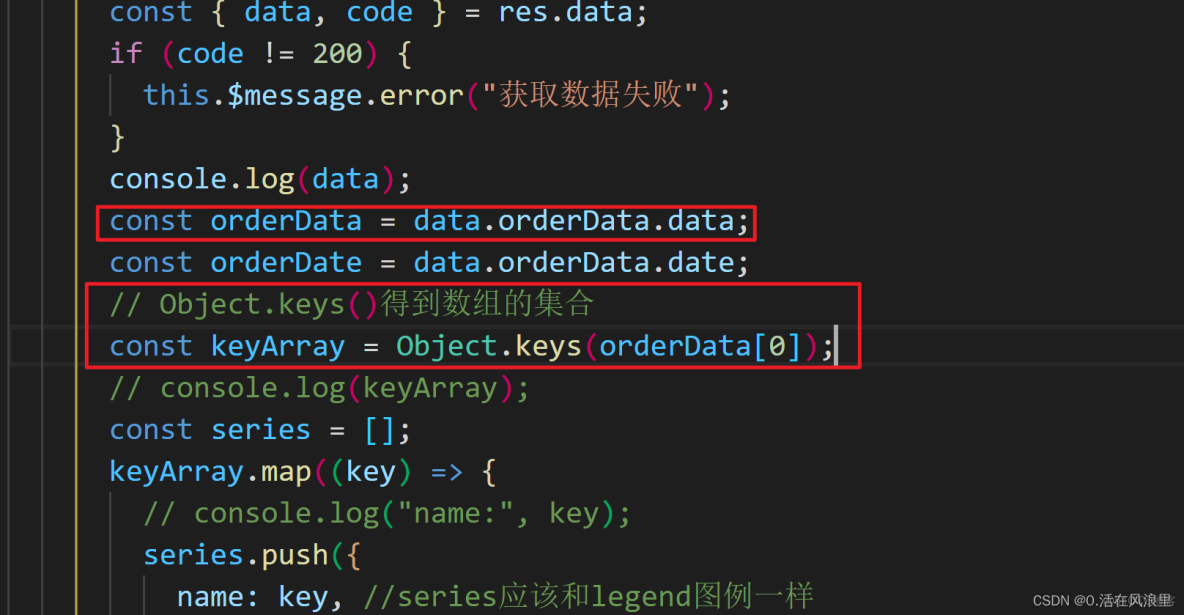
series配置數據
- name和data一樣都需要遍歷
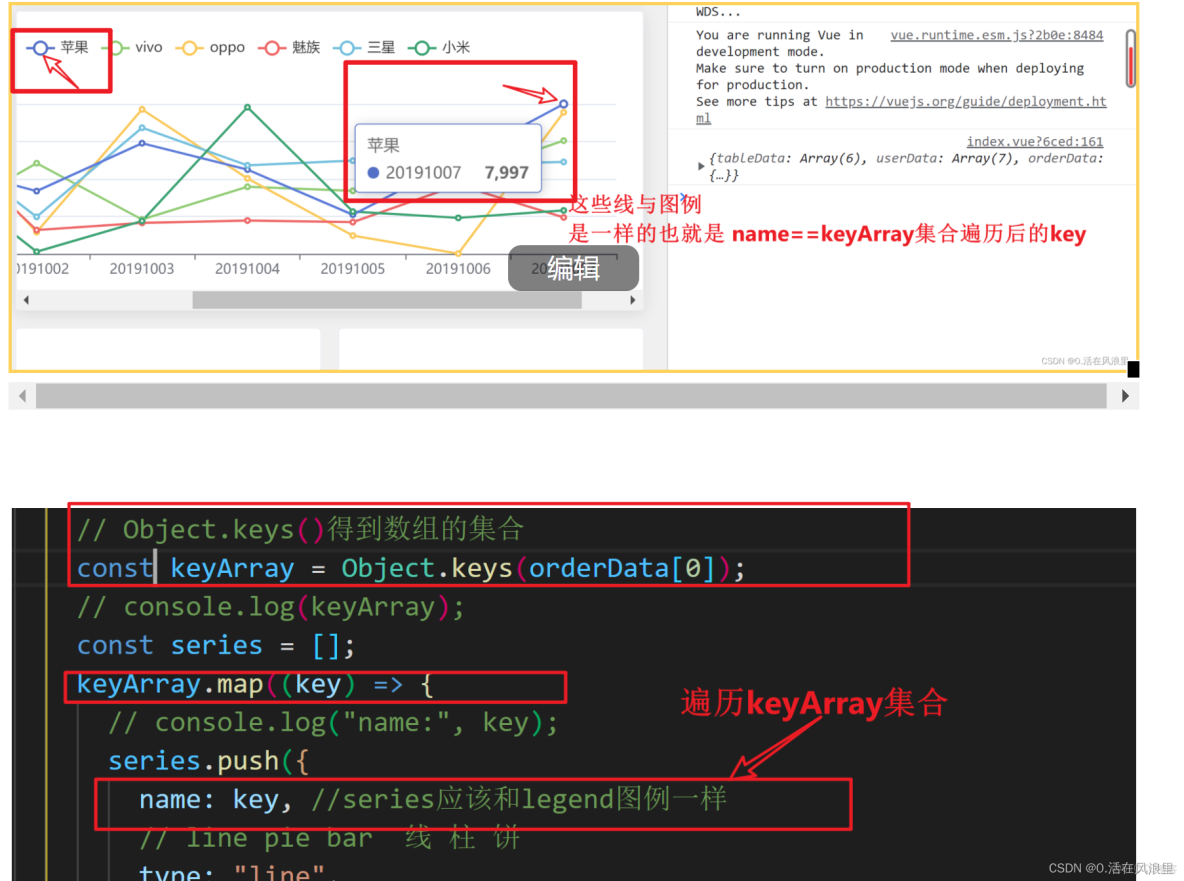
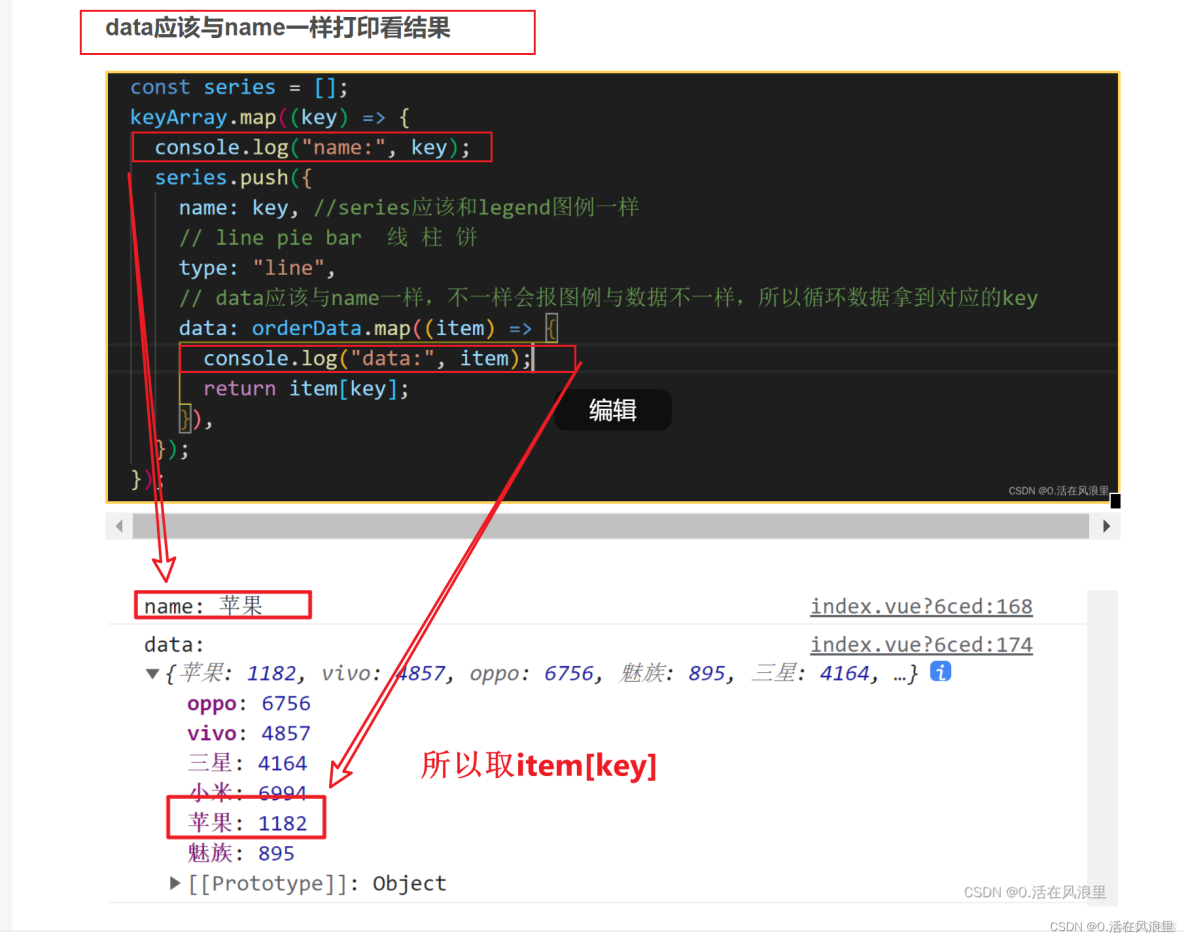
data=orderData.map(item=>item[key])
源碼
mounted() {
//echarts實例需要獲取dom,所以需要在mounted中初始化
this.$http.post(this.$url).then((res) => {
// console.log(res);
const { data, code } = res.data;
if (code != 200) {
this.$message.error("獲取數據失敗");
}
console.log(data);
const orderData = data.orderData.data;
const orderDate = data.orderData.date;
// Object.keys()得到數組的集合
const keyArray = Object.keys(orderData[0]);
// console.log(keyArray);
const series = [];
keyArray.map((key) => {
series.push({
name: key, //series應該和legend圖例一樣
// line pie bar 線 柱 餅
type: "line",
// data應該與name一樣,不一樣會報圖例與數據不一樣,所以循環數據拿到對應的key
data: orderData.map((item) => {
return item[key];
}),
});
});
var myChart = echarts.init(document.getElementById("eacharts"));
// 指定圖表的配置項和數據
var option = {
title: {
text: "折線圖 ",
},
// 提示框組件
tooltip: {},
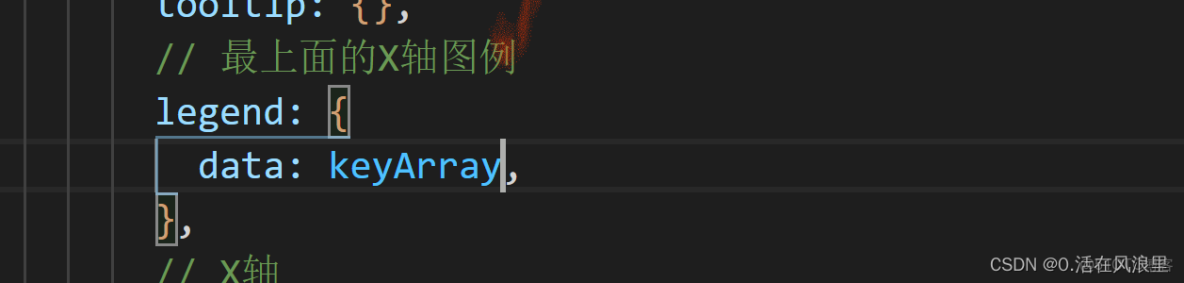
// 最上面的X軸圖例
legend: {
data: series.name,
},
// X軸
xAxis: {
data: orderDate,
},
// y軸
yAxis: {},
// 所需要展示的數據,需要配置遍歷
series: series,
};
// 使用剛指定的配置項和數據顯示圖表。
myChart.setOption(option);
});
},柱狀圖
template

js mounted
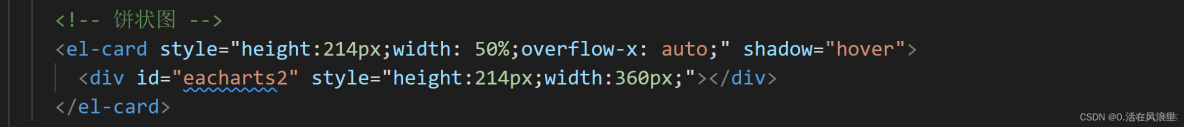
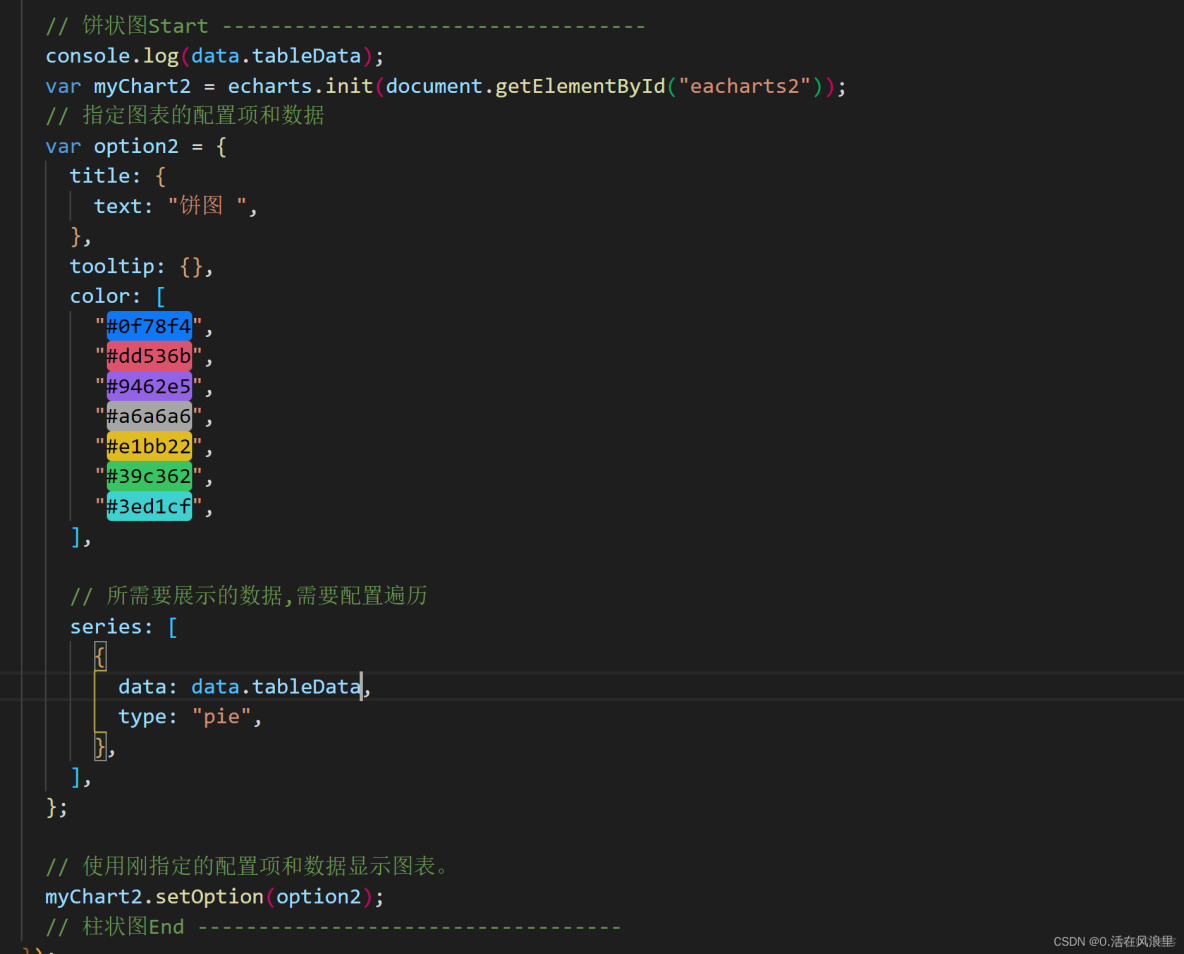
餅圖
- 毫無難度的餅圖
template
js mounted
完整效果
更新中...
2022/5/19 22:25
祝大家2022越來越強
本文章為轉載內容,我們尊重原作者對文章享有的著作權。如有內容錯誤或侵權問題,歡迎原作者聯繫我們進行內容更正或刪除文章。