
1,代理客户端安裝和配置
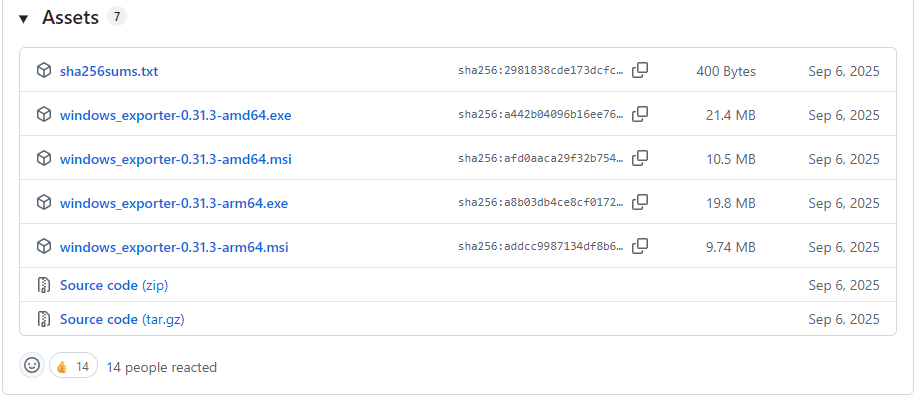
下載地址:https://github.com/prometheus-community/windows_exporter/releases
1.1 這裏需要下載msi安裝包,
exe文件需要手動執行,且不會自動啓動,直接下載一個msi安裝包安裝,會自動生成服務以及自動啓動。
1.2 根據prometheus版本來決定下載window_exporter的版本,最新版本的exporter並不一定適配你的prometheus服務端,最好是跟prometheus發佈時間差不多的exporter,否則可能會出現各種異常問題。
筆者是一個prometheus-2.47.0的prometheus,下載了最新版的window_exporter-0.31.3,安裝後在grafana面板上,收集不到一些服務器的信息,最後退回到windows_exporter-0.29.0才恢復正常。
windows_exporter安裝後生成的服務。
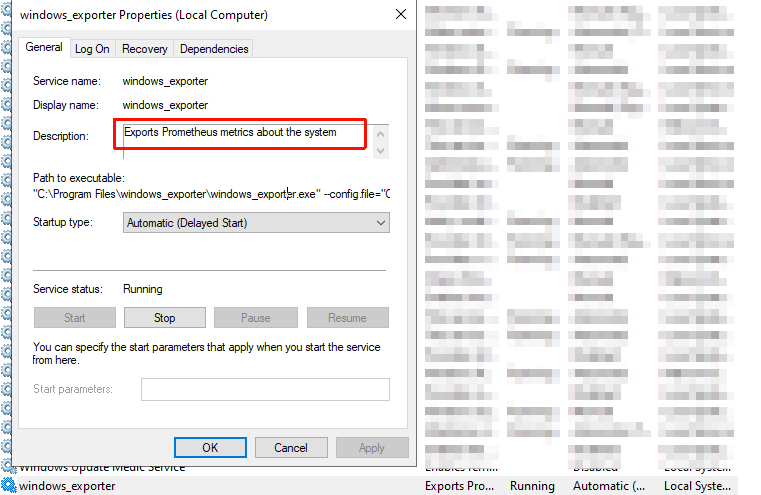
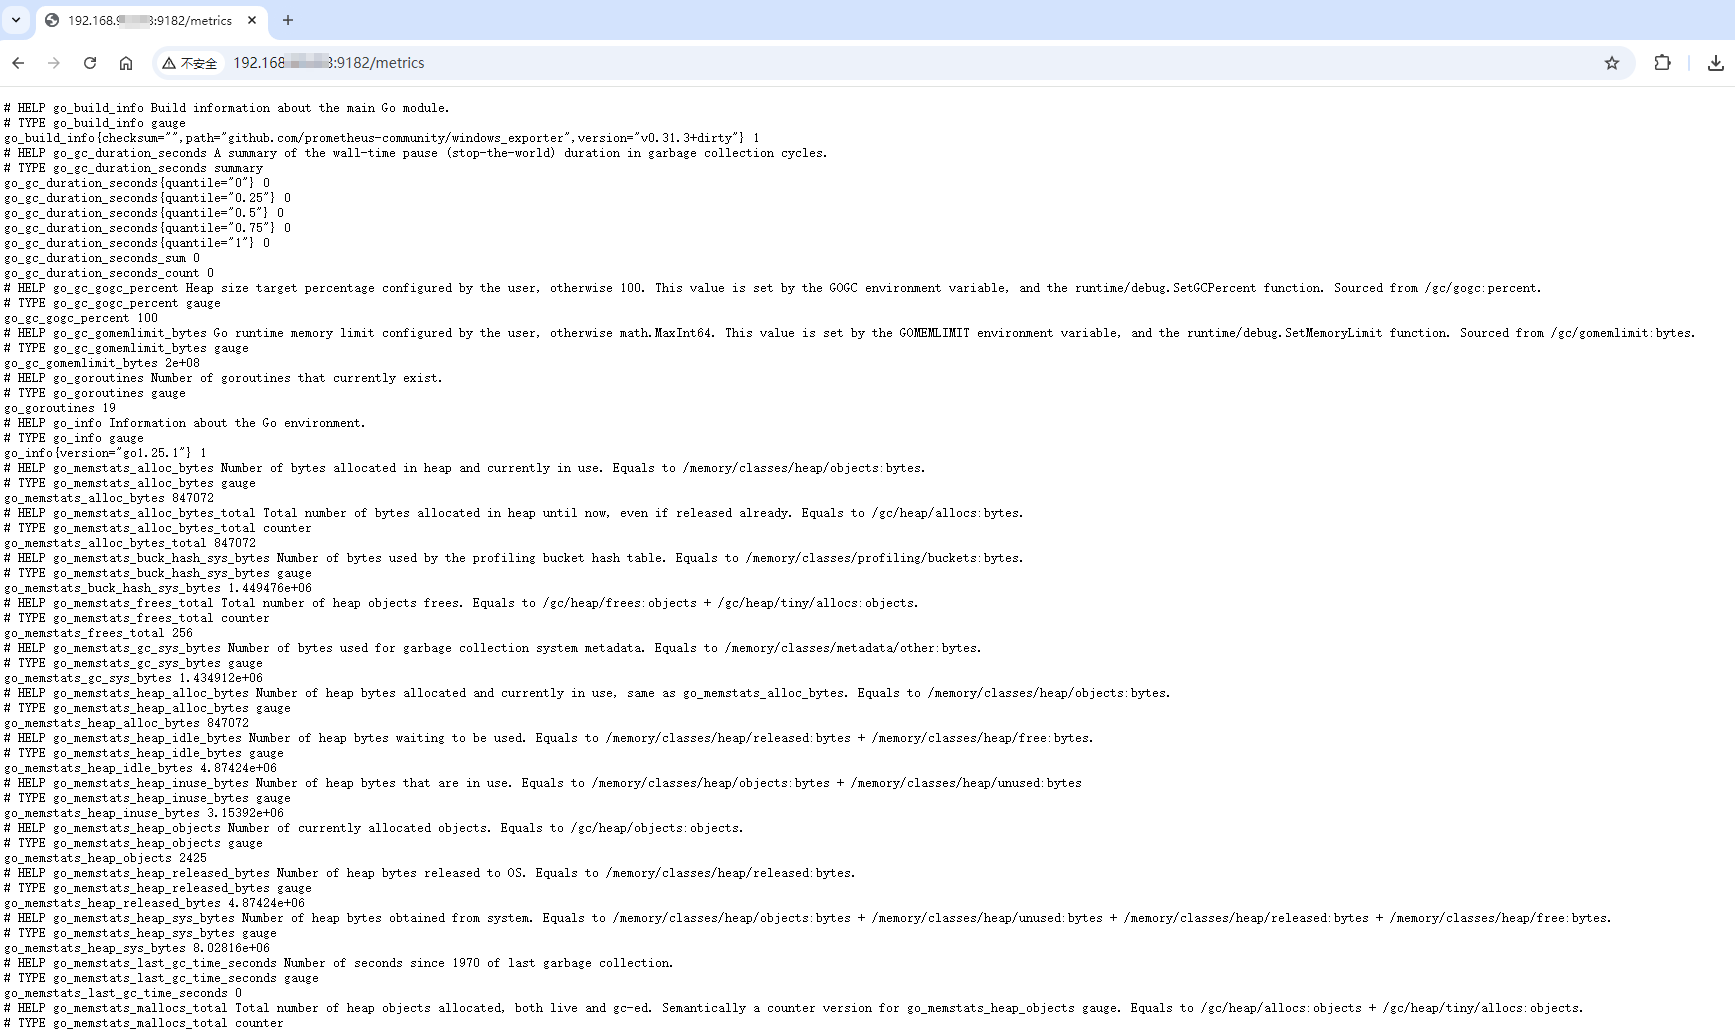
windows_exporter安裝後生成的http服務,http://192.168.1.4:9182/metrics 也即暴露給prometheus服務端的接口
2,服務端配置
2.1 修改prometheus的配置文件,在windows_performance_monitor這個標籤頁中增加上述服務IP地址和端口號,如果沒有可以直接配置。
  - job_name: 'windows_performance_monitor'
    static_configs:
      - targets: ['192.168.1.1:9182','192.168.1.2:9182','192.168.1.3:9182','192.168.1.4:9182']
        labels:
          install: 'qa_performance_test_server'
2.2 重啓prometheus服務
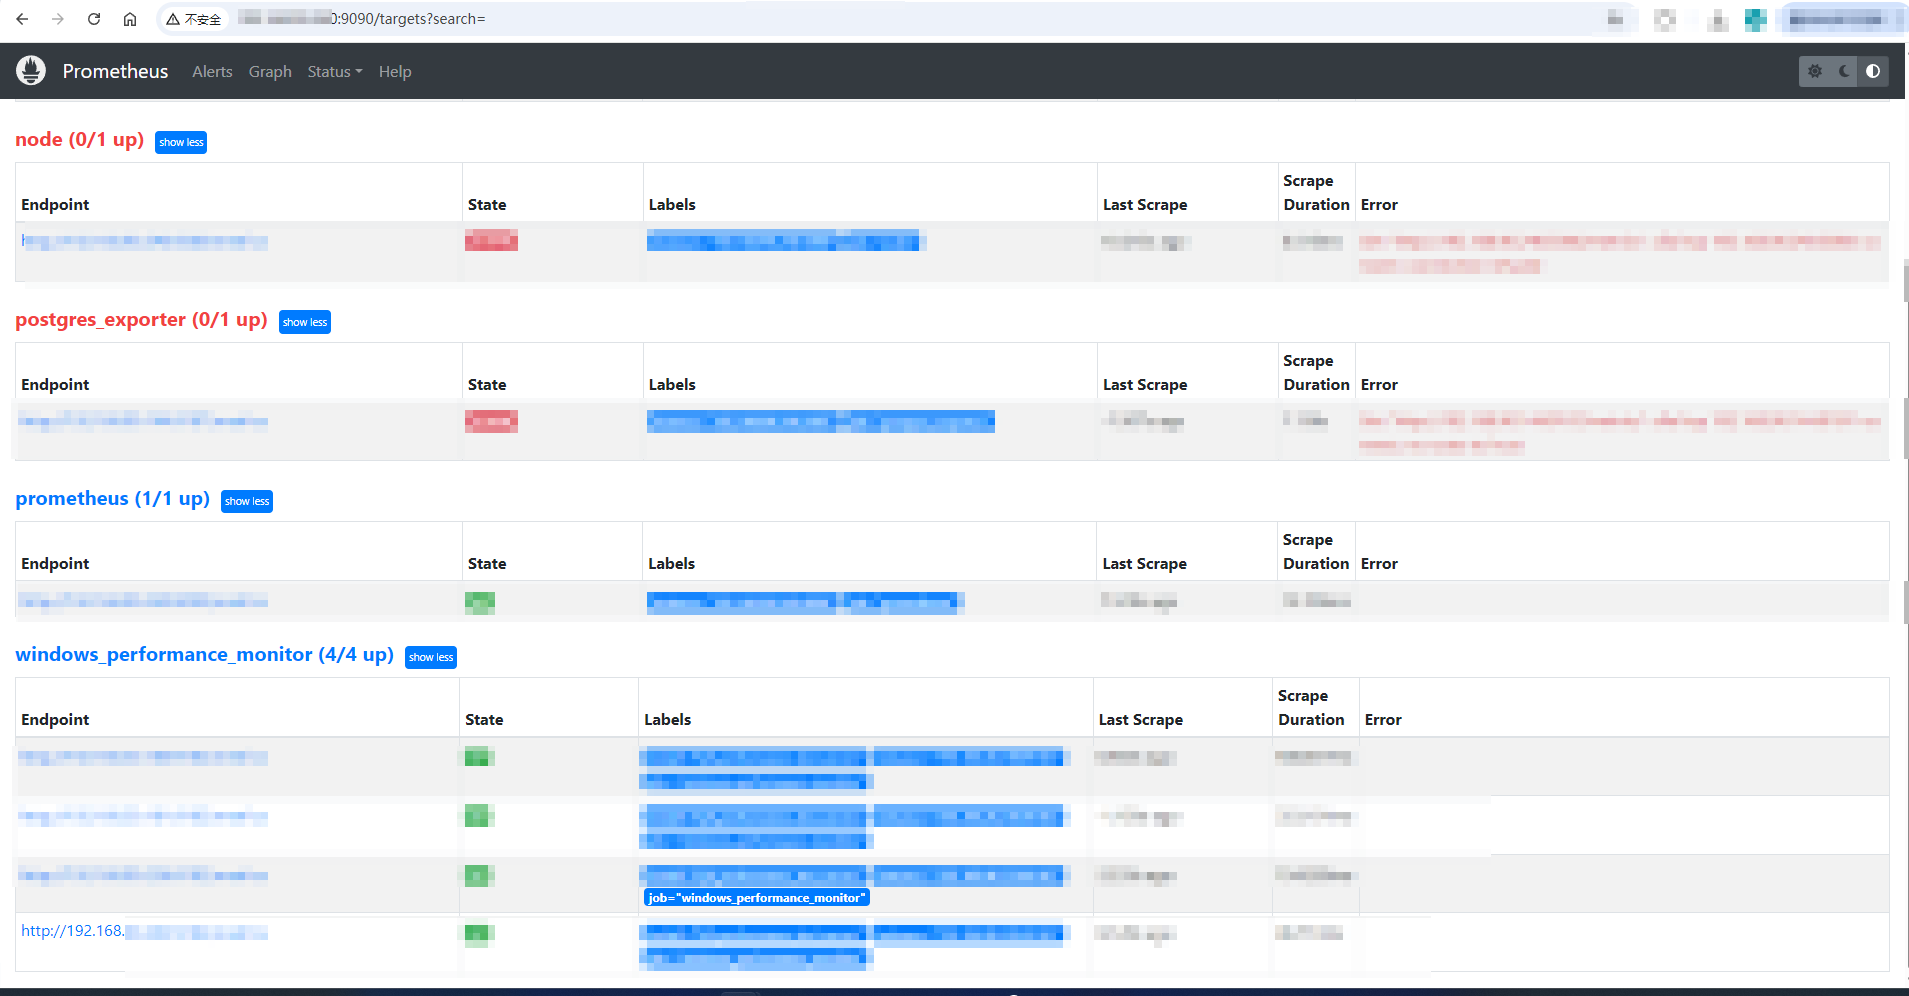
進入prometheus的後台管理頁面 http://192.168.*.*:9090/targets?search=,在windows_performance_monitor標籤頁下面可以發現新增的服務器配置,這個endpoint地址http://192.168.1.4:9182/metrics實際上就是上述客户端暴露給服務端的數據採集入口
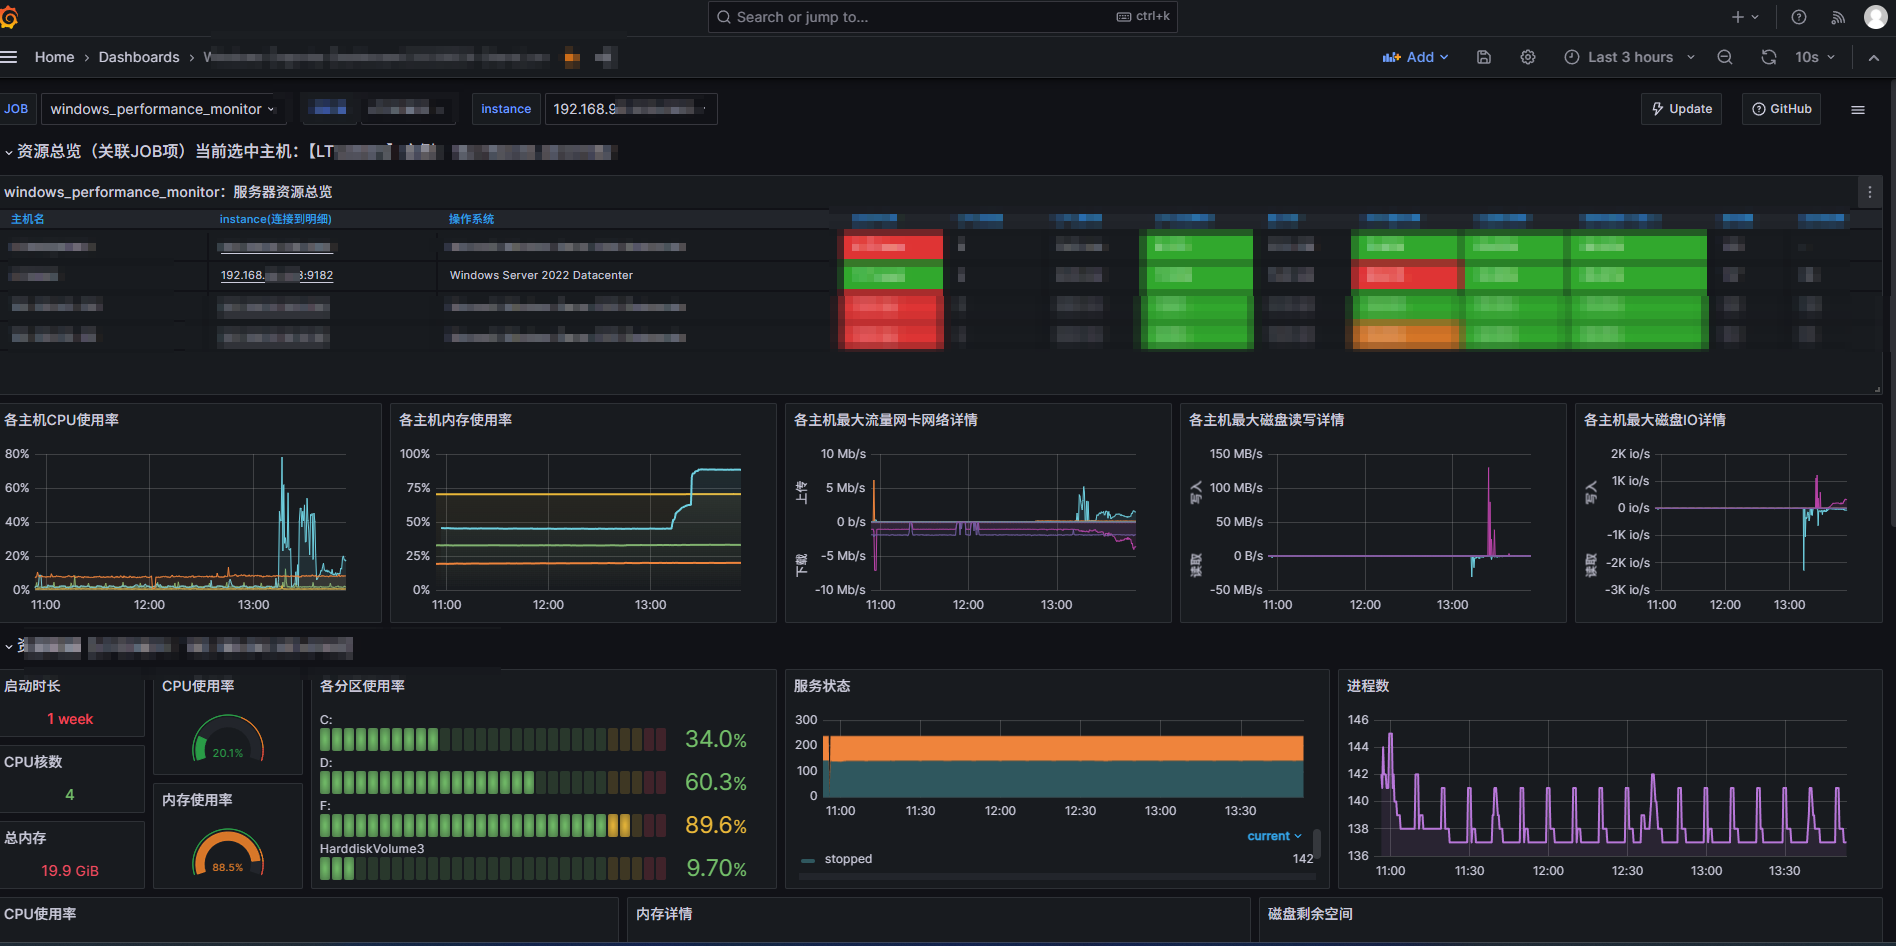
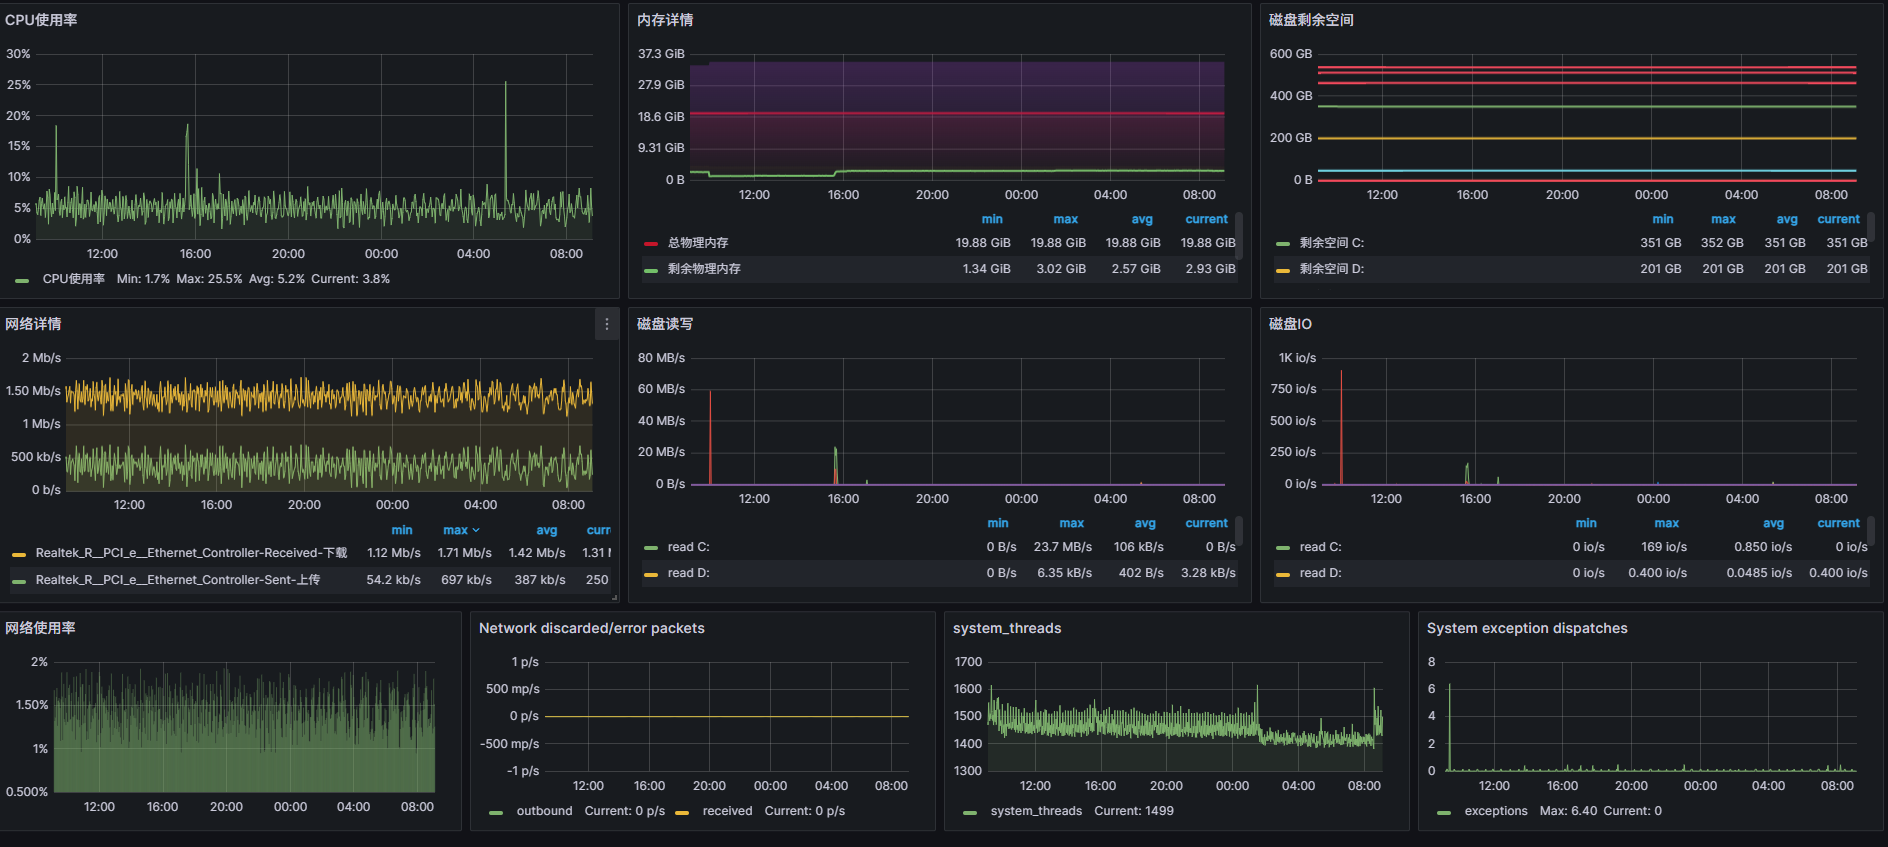
2.3 回到grafana的監控面板,會發現已經將目標服務器載入監控列表。