
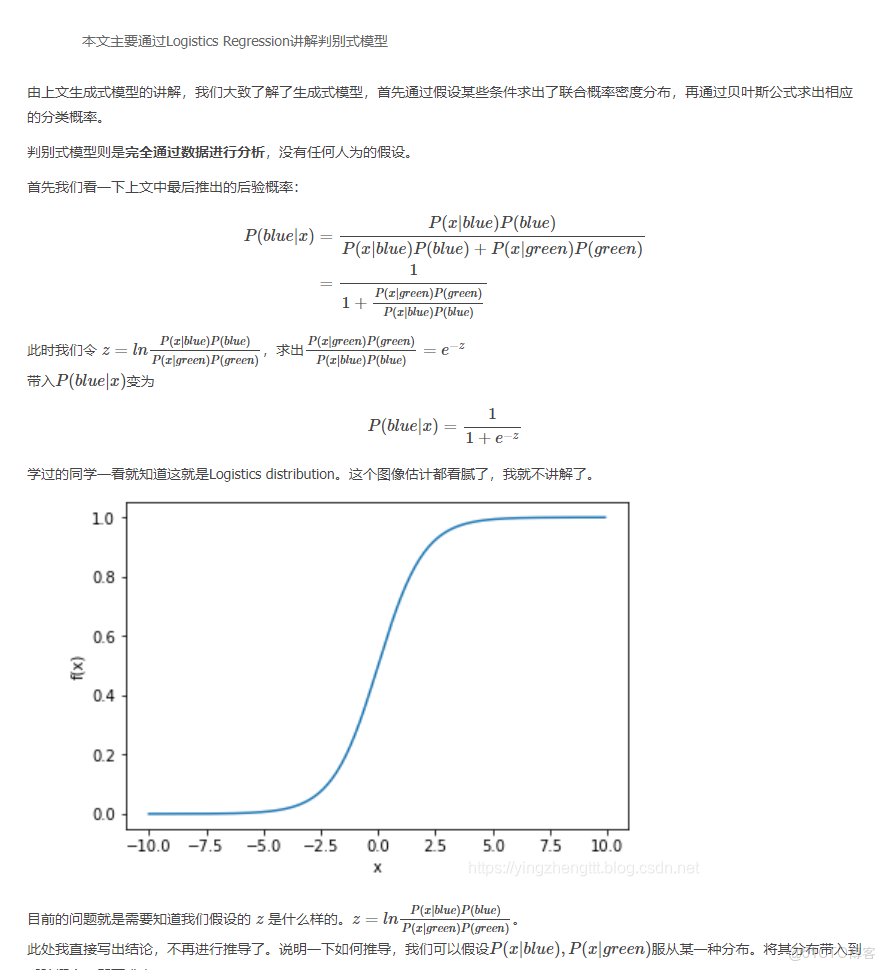
畫出\(P(blue|x)\)的等高線可以看出在概率為0.5時還是能較好的分開兩組數據

可以看出判別式模型中,完全是依據數據進行的分析,沒有添加任何人為的假設(對於任意的分佈\(z\)都滿足\(z=wx+b\)的形式),直接根據貝葉斯後驗概率進行的推導。
至此兩種模型都講完,這兩者模型各有優缺點,當數據很少的時候,或許生成式模型中人為加入的限制更加有利於數據的分類,這會使得擬合效果更好。
附上代碼:
# classification
# only use part[0] & part[1]
# @author Hongchuan CAO
# @date 2019-7-8
from sklearn import datasets
import numpy as np
import matplotlib.pyplot as plt
class SGD(object):
def __init__(self):
self.iris = datasets.load_iris()
self.part = [[], [], []]
def classify(self):
for i in range(len(self.iris.target)):
self.part[self.iris.target[i]].append(self.iris.data[i, :2])
# change list to array
for i in range(0, 3):
self.part[i] = np.array(self.part[i])
print(self.part[0][1])
def gradient(self):
w = np.array([1., 1.])
b = 4
learn_ratio = 0.001
iteration = 10000
for j in range(iteration):
sum_w = np.array([0., 0.])
sum_b = 0
for i in range(len(self.part[0])):
sum_w += (1.0 / (1 + np.exp(-1 * (np.dot(w, self.part[0][i].T) + b))) - 1) * self.part[0][i]
sum_b += (1.0 / (1 + np.exp(-1 * (np.dot(w, self.part[0][i].T) + b))) - 1)
for i in range(len(self.part[1])):
sum_w += (1.0 / (1 + np.exp(-1 * (np.dot(w, self.part[1][i].T) + b)))) * self.part[1][i]
sum_b += (1.0 / (1 + np.exp(-1 * (np.dot(w, self.part[1][i].T) + b))))
w = w - learn_ratio * sum_w / (len(self.part[0]) + len(self.part[1]))
b = b - learn_ratio * sum_b / (len(self.part[0]) + len(self.part[1]))
print(j, '-----------')
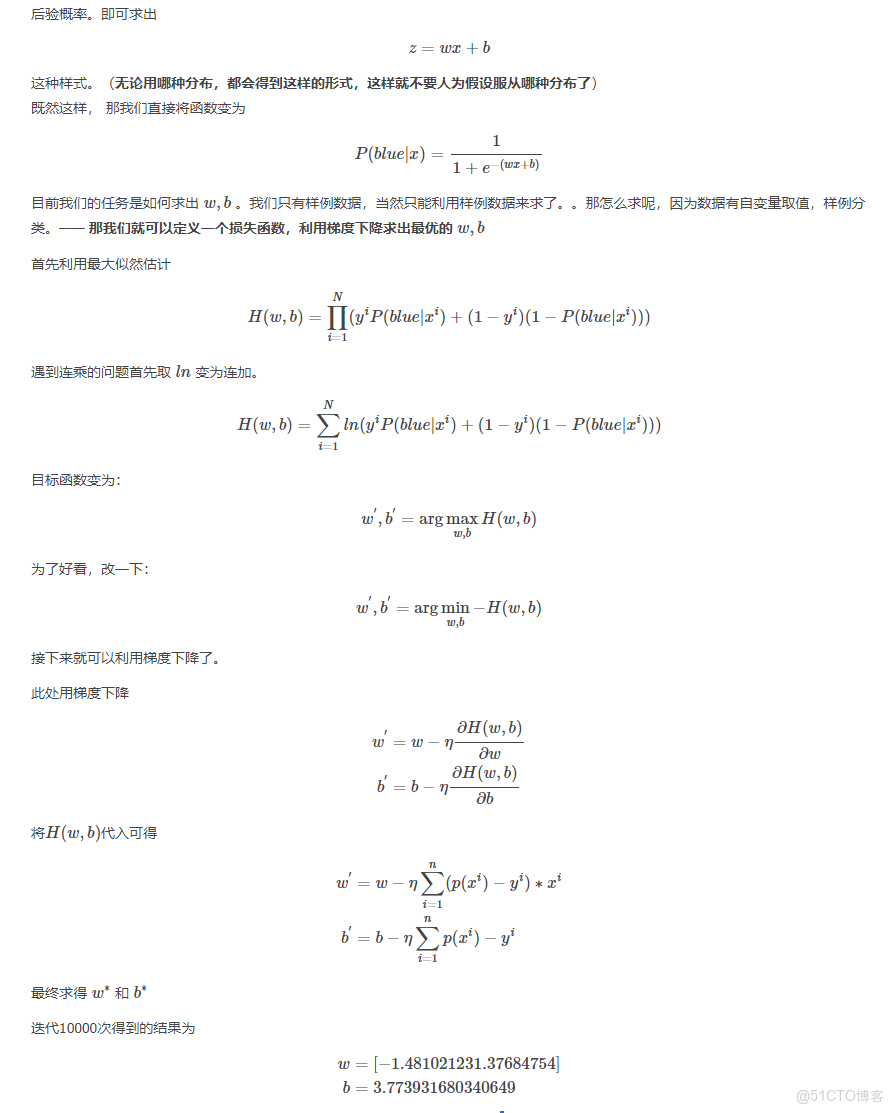
print(w,b)
return w, b
def ff(self, w, b, x):
return 1.0 / (1 + np.exp(-1 * (np.dot(w, x.T) + b)))
def plot1(self):
w, b = self.gradient()
xx = [x for x in np.arange(2, 8, 0.1)]
yy = [y for y in np.arange(1, 7, 0.1)]
Z = [[self.ff(w, b, np.array([x, y])) for x in xx] for y in yy]
X, Y = np.meshgrid(xx, yy)
cntr1 = plt.contourf(X, Y, Z)
plt.clabel(cntr1, colors='k', inline_spacing=3, fmt='%.1f', fontsize=10)
plt.plot(self.part[0][:, 0], self.part[0][:, 1], 'b.', label='0')
plt.plot(self.part[1][:, 0], self.part[1][:, 1], 'g.', label='1')
# plt.plot(self.part[2][:,0], self.part[2][:,1], 'r.', label='2')
plt.legend()
plt.xlabel('attribute0')
plt.ylabel('attribute1')
plt.show()
if __name__ == '__main__':
obj = SGD()
obj.classify()
obj.plot1()
本文章為轉載內容,我們尊重原作者對文章享有的著作權。如有內容錯誤或侵權問題,歡迎原作者聯繫我們進行內容更正或刪除文章。