
flask與sanic框架對比
我在服務器端運行web服務,在本地Windows環境下利用ab對web服務進行壓力測試。分析可以分作兩個部分:
- flask+gunicorn與sanic的對比;
- flask+gunicorn與sanic+uvicorn的對比;
主要的參考指標包括:
- Time taken for tests,即處理請求所花費的總時間;
- Requests per second,即吞吐量;
- user time per request,即用户每請求所花費的時間;
- Time per request,每請求平均花費時間;
下面利用圖標的形式對所得數據進行一個解析:
flask+gunicorn對比sanic
表中(n,c)代表(總請求數,併發數)
|
測試框架
|
(n,c)
|
Time taken for tests
|
Requests per second
|
user Time per request
|
Time per request
|
|
flask+gunicorn -w 8
|
(100 ,10)
|
0.031
|
3227.58
|
3.098
|
0.31
|
|
flask+gunicorn -w 8
|
(100 ,50)
|
0.016
|
6401.64
|
7.811
|
0.156
|
|
flask+gunicorn -w 8
|
(100 ,100)
|
0.03
|
3278.69
|
30.5
|
0.305
|
|
flask+gunicorn -w 8
|
(500 ,50)
|
0.125
|
4007.31
|
12.477
|
0.25
|
|
flask+gunicorn -w 8
|
(500 ,100)
|
0.109
|
4572.52
|
21.87
|
0.219
|
|
flask+gunicorn -w 8
|
(1000 ,200)
|
0.229
|
4362.03
|
45.85
|
0.229
|
|
sanic
|
(100 ,10)
|
0.068
|
1468.28
|
6.811
|
0.681
|
|
sanic
|
(100 ,50)
|
0.059
|
1681.55
|
29.735
|
0.595
|
|
sanic
|
(100 ,100)
|
0.058
|
1732.50
|
57.72
|
0.577
|
|
sanic
|
(500 ,50)
|
0.292
|
1771.28
|
29.128
|
0.584
|
|
sanic
|
(500 ,100)
|
0.314
|
1592.13
|
62.809
|
0.628
|
|
sanic
|
(1000 ,200)
|
0.6
|
1667.02
|
119.975
|
0.6
|
總響應時間
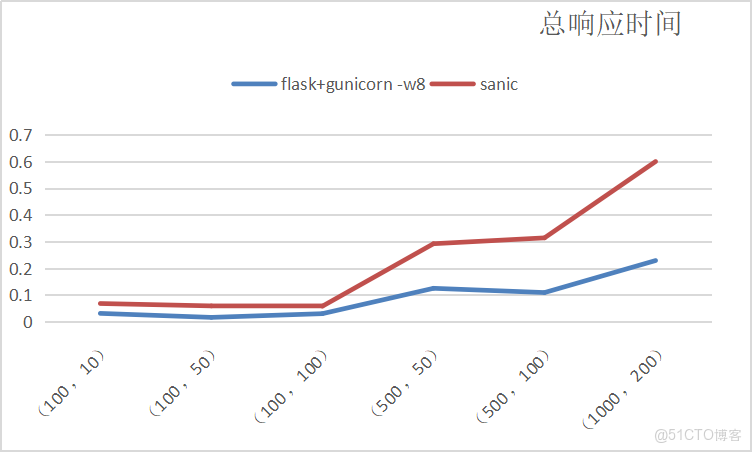
對總響應時間可以看出,sanic的總響應時間明顯長於flask+gunicorn
吞吐量
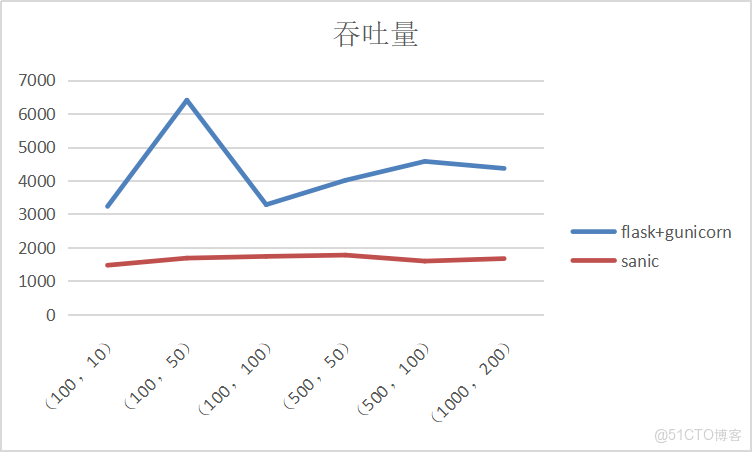
圖片表明sanic的吞吐量明顯的低於flask配合gunicorn;
用户每請求所花費的時間
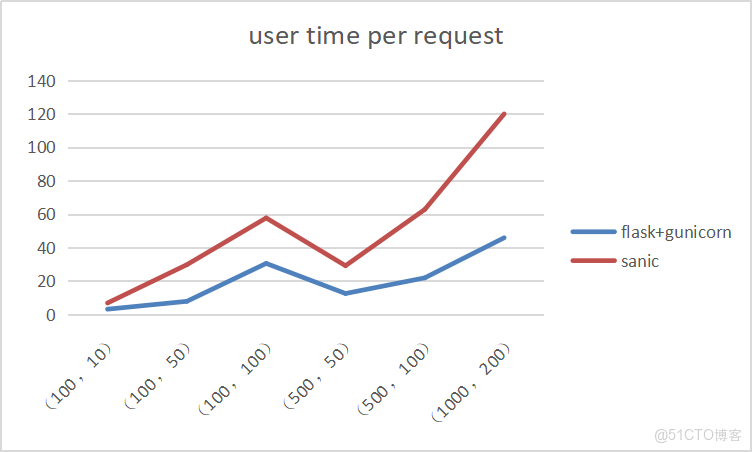
sanic用户每請求所花費的時間明顯長於flask+gunicorn
每請求平均花費時間
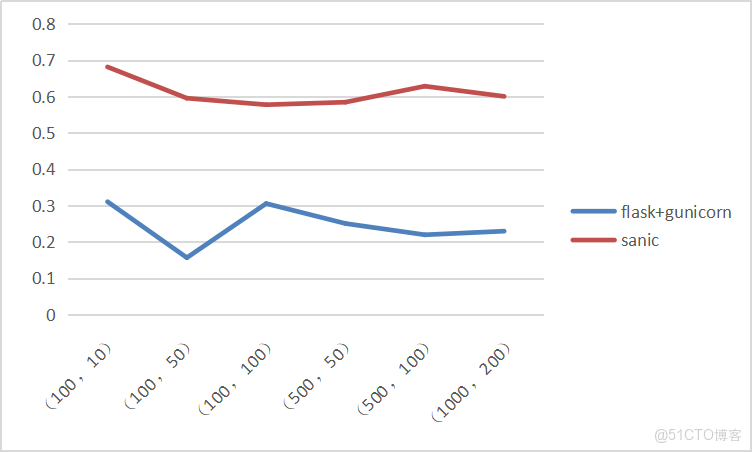
sanic所花費的時間明顯要多
flask+gunicorn對比sanic+uvicorn
|
測試框架
|
(n,c)
|
Time taken for tests
|
Requests per second
|
user Time per request
|
Time per request
|
|
sanic+uvicorn -w 8
|
(100 ,100)
|
0.035
|
2869.52
|
34.869
|
0.348
|
|
sanic+uvicorn -w 8
|
(1000 ,100)
|
0.252
|
3970.54
|
25.186
|
0.252
|
|
sanic+uvicorn -w 8
|
(10000 ,100)
|
3.432
|
2913.64
|
34.321
|
0.343
|
|
sanic+uvicorn -w 8
|
(10000 ,500)
|
5.544
|
1803.77
|
277.197
|
0.554
|
|
sanic+uvicorn -w 8
|
(10000 ,1000)
|
5.425
|
1843.44
|
542.465
|
0.542
|
|
flask+gunicorn -w 8
|
(100 ,100)
|
0.03
|
3278.69
|
30.5
|
0.305
|
|
flask+gunicorn -w 8
|
(1000 ,100)
|
0.221
|
4526.18
|
22.094
|
0.221
|
|
flask+gunicorn -w 8
|
(10000 ,100)
|
2.163
|
4623.68
|
21.628
|
0.216
|
|
flask+gunicorn -w 8
|
(10000 ,500)
|
2.375
|
4210.55
|
118.749
|
0.237
|
|
flask+gunicorn -w 8
|
(10000 ,1000)
|
2.461
|
4063.54
|
246.091
|
0.246
|
總響應時間
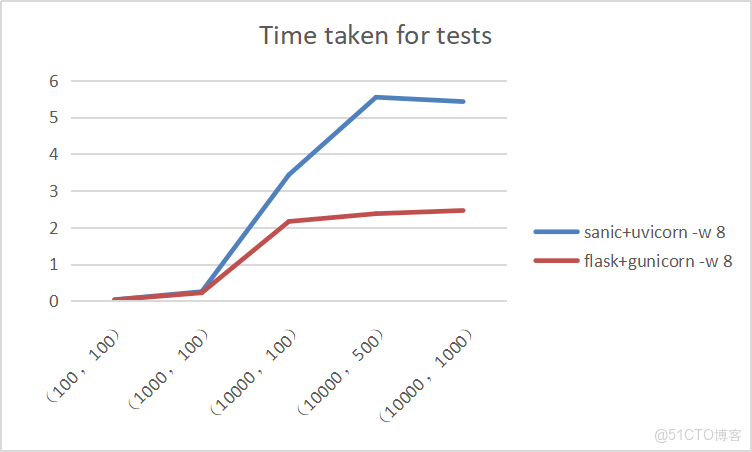
對總響應時間可以看出,sanic+uvicorn的總響應時間明顯長於flask+gunicorn
吞吐量
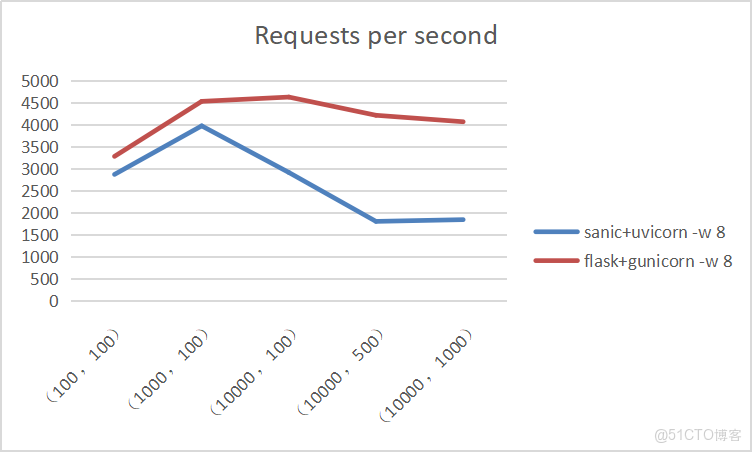
圖片表明sanic+uvicorn的吞吐量明顯的低於flask配合gunicorn;
用户每請求所花費的時間
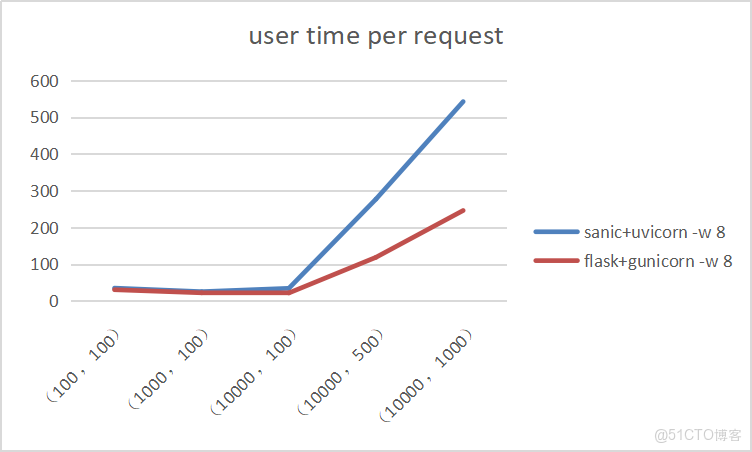
sanic+uvicorn用户每請求所花費的時間明顯長於flask+gunicorn
每請求平均花費時間
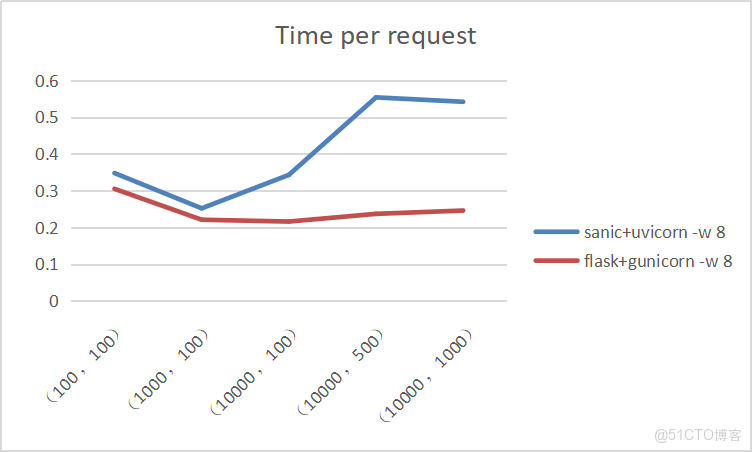
sanic+uvicorn所花費的時間明顯要多
結論
通過上面的分析我們看到無論從哪一個方面出發,flask+gunicorn的搭配的在這個測試案例中的結果還是優於sanic的。而且,通過調查,發現將sanic當作web接口框架的企業寥寥無幾。從穩妥的角度出發,建議還是繼續沿用flask+gunicorn的框架搭建web接口以達到預期目的。