
通過Filebeat採集日誌,本文以Nginx日誌為例 --> kafka topic存儲日誌 --> logstash去kafka獲取日誌,進行格式轉換 --> elasticsearch --> kibana。
一、環境準備
實驗環境如下:
|
序號 |
主機名稱 |
IP地址 |
操作系統 |
|
1 |
k8s-master |
192.168.60.128 |
Centos7.9 |
|
2 |
k8s-node1 |
192.168.60.129 |
Centos7.9 |
|
3 |
k8s-node2 |
192.168.60.130 |
Centos7.9 |
二、安裝部署
2.1、安裝Zookeeper集羣
2.1.1、zookeeper簡介
zookeeper就是動物園管理員,他是用來管hadoop(大象)、Hive(蜜蜂)、pig(小豬)、kafka消息系統的管理員, Apache Hbase 和 Apache Solr 的分佈式集羣都用到了 zookeeper;Zookeeper是一個分佈式的、開源的程序協調服務,是hadoop項目下的一個子項目。他提供的主要功能包括:配置管理、名字服務、分佈式鎖、集羣管理。
Zookeeper主要作用在於:
1. 節點選舉
Master節點,主節點掛了之後,從節點就會接手工作 ,並且,保證這個節點是唯一的,這就是首腦模式,從而保證集羣的高可用。
2. 統一配置文件管理
只需要部署一台服務器,則可以把相同的配置文件,同步更新到其他所有服務器,比如,修改了Hadoop,Kafka,redis統一配置等。
3. 發佈與訂閲消息
類似於消息隊列,發佈者把數據存在node節點上,訂閲者會讀取這個數據。
4. 集羣管理
1、集羣中保證數據的一致性。
2、zookeeper的選舉機制
- 過半機制;安裝的台數奇數台(否則無法過半機制),多得好處在於可靠性高,但是過的話會導致通信延時長。
zookeeper角色:
leader:負責發起選舉和決議的,更新系統狀態。
follower:接收客户端的請求,給客户端返回結果,在選主的過程參與投票。
observe:接收客户端的連接,同步leader狀態,不參與選主。
2.1.2、安裝zookeeper
將下載好的安裝包上傳至服務器:
k8s-master:
[root@k8s-master ~]# ls /home/rshine/
apache-zookeeper-3.8.0-bin.tar.gz  filebeat-7.13.1-linux-x86_64.tar.gz  logstash-7.9.2.tar.gz
calico.tar.gz                      kafka_2.13-3.1.0.tgz
[root@k8s-master ~]#
[root@k8s-master ~]# tar -xzf /home/rshine/apache-zookeeper-3.8.0-bin.tar.gz -C /opt/
[root@k8s-master ~]# cd /opt/
[root@k8s-master opt]# mv apache-zookeeper-3.8.0-bin zookeeper
[root@k8s-master opt]# mkdir -p zookeeper/zkData zookeeper/zkLog
[root@k8s-master opt]# cd zookeeper/conf
[root@k8s-master conf]# cp -a zoo_sample.cfg zoo.cfg
[root@k8s-master conf]# vim zoo.cfg
# The number of milliseconds of each tick
tickTime=2000
# The number of ticks that the initial
# synchronization phase can take
initLimit=10
# The number of ticks that can pass between
# sending a request and getting an acknowledgement
syncLimit=5
# the directory where the snapshot is stored.
# do not use /tmp for storage, /tmp here is just
# example sakes.
# the port at which the clients will connect
clientPort=2181
# the maximum number of client connections.
# increase this if you need to handle more clients
#maxClientCnxns=60
#
# Be sure to read the maintenance section of the
# administrator guide before turning on autopurge.
#
# https://zookeeper.apache.org/doc/current/zookeeperAdmin.html#sc_maintenance
#
# The number of snapshots to retain in dataDir
#autopurge.snapRetainCount=3
# Purge task interval in hours
# Set to "0" to disable auto purge feature
#autopurge.purgeInterval=1

## Metrics Providers
#
# https://prometheus.io Metrics Exporter
#metricsProvider.className=org.apache.zookeeper.metrics.prometheus.PrometheusMetricsProvider
#metricsProvider.httpHost=0.0.0.0
#metricsProvider.httpPort=7000
#metricsProvider.exportJvmInfo=true

dataDir=/opt/zookeeper
dataLogDir=/opt/zookeeper/zkLog
server.1=192.168.60.128:2888:3888
server.2=192.168.60.129:2888:3888
server.3=192.168.60.130:2888:3888
[root@k8s-master conf]# yum -y install java		# 安裝Java程序
[root@k8s-master conf]# cd ../
# 創建myid文件,並寫入id值,這個id值與配置文件中server.1=192.168.60.128:2888:3888中的.1保持一致,IP地址也必須和本機IP保持一致。
[root@k8s-master zookeeper]# echo 1 > myid
[root@k8s-master zookeeper]# ./bin/zkServer.sh start ./conf/zoo.cfg
[root@k8s-master zookeeper]# ss -tanlp |grep 2181
LISTEN     0      50        [::]:2181                  [::]:*                   users:(("java",pid=4814,fd=56))
[root@k8s-master zookeeper]#
[root@k8s-master zookeeper]#
[root@k8s-master zookeeper]# ss -tanlp |grep 4814
LISTEN     0      50     [::ffff:192.168.60.128]:3888                  [::]:*                   users:(("java",pid=4814,fd=65))
LISTEN     0      50        [::]:8080                  [::]:*                   users:(("java",pid=4814,fd=60))
LISTEN     0      50        [::]:35666                 [::]:*                   users:(("java",pid=4814,fd=52))
LISTEN     0      50        [::]:2181                  [::]:*                   users:(("java",pid=4814,fd=56))
[root@k8s-master zookeeper]#
[root@k8s-master zookeeper]# ./bin/zkCli.sh -server 127.0.0.1:2181
[zk: 127.0.0.1:2181(CONNECTED) 0] create /test2 "Rshine"
Created /test2
[zk: 127.0.0.1:2181(CONNECTED) 1] get /test2
Rshine
[zk: 127.0.0.1:2181(CONNECTED) 2]
k8s-node1:
[root@k8s-node1 ~]# ls /home/rshine/
apache-zookeeper-3.8.0-bin.tar.gz  filebeat-7.13.1-linux-x86_64.tar.gz  logstash-7.9.2.tar.gz
calico.tar.gz                      kafka_2.13-3.1.0.tgz
[root@k8s-node1 ~]#
[root@k8s-node1 ~]# tar -xzf /home/rshine/apache-zookeeper-3.8.0-bin.tar.gz -C /opt/
[root@k8s-node1 ~]# cd /opt/
[root@k8s-node1 opt]# mv apache-zookeeper-3.8.0-bin zookeeper
[root@k8s-node1 opt]# mkdir -p zookeeper/zkData zookeeper/zkLog
[root@k8s-node1 opt]# cd zookeeper/conf
[root@k8s-node1 conf]# cp -a zoo_sample.cfg zoo.cfg
[root@k8s-node1 conf]# vim zoo.cfg
# The number of milliseconds of each tick
tickTime=2000
# The number of ticks that the initial
# synchronization phase can take
initLimit=10
# The number of ticks that can pass between
# sending a request and getting an acknowledgement
syncLimit=5
# the directory where the snapshot is stored.
# do not use /tmp for storage, /tmp here is just
# example sakes.
# the port at which the clients will connect
clientPort=2181
# the maximum number of client connections.
# increase this if you need to handle more clients
#maxClientCnxns=60
#
# Be sure to read the maintenance section of the
# administrator guide before turning on autopurge.
#
# https://zookeeper.apache.org/doc/current/zookeeperAdmin.html#sc_maintenance
#
# The number of snapshots to retain in dataDir
#autopurge.snapRetainCount=3
# Purge task interval in hours
# Set to "0" to disable auto purge feature
#autopurge.purgeInterval=1

## Metrics Providers
#
# https://prometheus.io Metrics Exporter
#metricsProvider.className=org.apache.zookeeper.metrics.prometheus.PrometheusMetricsProvider
#metricsProvider.httpHost=0.0.0.0
#metricsProvider.httpPort=7000
#metricsProvider.exportJvmInfo=true

dataDir=/opt/zookeeper
dataLogDir=/opt/zookeeper/zkLog
server.1=192.168.60.128:2888:3888
server.2=192.168.60.129:2888:3888
server.3=192.168.60.130:2888:3888
[root@k8s-node1 conf]# yum -y install java		# 安裝Java程序
[root@k8s-node1 conf]# cd ../
# 創建myid文件,並寫入id值,這個id值與配置文件中server.2=192.168.60.129:2888:3888中的.2保持一致,IP地址也必須和本機IP保持一致。
[root@k8s-node1 zookeeper]# echo 2 > myid
[root@k8s-node1 zookeeper]# ./bin/zkServer.sh start ./conf/zoo.cfg
[root@k8s-node1 zookeeper]# ss -tanlp |grep 2181
LISTEN     0      50        [::]:2181                  [::]:*                   users:(("java",pid=113223,fd=56))
[root@k8s-node1 zookeeper]# ss -tanlp |grep 113223
LISTEN     0      50        [::]:35543                 [::]:*                   users:(("java",pid=113223,fd=52))
LISTEN     0      50        [::]:2181                  [::]:*                   users:(("java",pid=113223,fd=56))
LISTEN     0      50     [::ffff:192.168.60.129]:3888                  [::]:*                   users:(("java",pid=113223,fd=66))
LISTEN     0      50        [::]:8080                  [::]:*                   users:(("java",pid=113223,fd=61))
[root@k8s-node1 zookeeper]#
k8s-node2:
[root@k8s-node2 ~]# ls /home/rshine/
apache-zookeeper-3.8.0-bin.tar.gz  filebeat-7.13.1-linux-x86_64.tar.gz  logstash-7.9.2.tar.gz
calico.tar.gz                      kafka_2.13-3.1.0.tgz
[root@k8s-node2 ~]#
[root@k8s-node2 ~]# tar -xzf /home/rshine/apache-zookeeper-3.8.0-bin.tar.gz -C /opt/
[root@k8s-node2 ~]# cd /opt/
[root@k8s-node2 opt]# mv apache-zookeeper-3.8.0-bin zookeeper
[root@k8s-node2 opt]# mkdir -p zookeeper/zkData zookeeper/zkLog
[root@k8s-node2 opt]# cd zookeeper/conf
[root@k8s-node2 conf]# cp -a zoo_sample.cfg zoo.cfg
[root@k8s-node2 conf]# vim zoo.cfg
# The number of milliseconds of each tick
tickTime=2000
# The number of ticks that the initial
# synchronization phase can take
initLimit=10
# The number of ticks that can pass between
# sending a request and getting an acknowledgement
syncLimit=5
# the directory where the snapshot is stored.
# do not use /tmp for storage, /tmp here is just
# example sakes.
# the port at which the clients will connect
clientPort=2181
# the maximum number of client connections.
# increase this if you need to handle more clients
#maxClientCnxns=60
#
# Be sure to read the maintenance section of the
# administrator guide before turning on autopurge.
#
# https://zookeeper.apache.org/doc/current/zookeeperAdmin.html#sc_maintenance
#
# The number of snapshots to retain in dataDir
#autopurge.snapRetainCount=3
# Purge task interval in hours
# Set to "0" to disable auto purge feature
#autopurge.purgeInterval=1

## Metrics Providers
#
# https://prometheus.io Metrics Exporter
#metricsProvider.className=org.apache.zookeeper.metrics.prometheus.PrometheusMetricsProvider
#metricsProvider.httpHost=0.0.0.0
#metricsProvider.httpPort=7000
#metricsProvider.exportJvmInfo=true

dataDir=/opt/zookeeper
dataLogDir=/opt/zookeeper/zkLog
server.1=192.168.60.128:2888:3888
server.2=192.168.60.129:2888:3888
server.3=192.168.60.130:2888:3888
[root@k8s-node2 conf]# yum -y install java		# 安裝Java程序
[root@k8s-node2 conf]# cd ../
# 創建myid文件,並寫入id值,這個id值與配置文件中server.3=192.168.60.130:2888:3888中的.3保持一致,IP地址也必須和本機IP保持一致。
[root@k8s-node2 zookeeper]# echo 3 > myid
[root@k8s-node2 zookeeper]# ./bin/zkServer.sh start ./conf/zoo.cfg
[root@k8s-node2 zookeeper]# ss -tanlp |grep 2181
LISTEN     0      50        [::]:2181                  [::]:*                   users:(("java",pid=95287,fd=56))
[root@k8s-node2 zookeeper]# ss -tanlp |grep 95287
LISTEN     0      50        [::]:44634                 [::]:*                   users:(("java",pid=95287,fd=52))
LISTEN     0      50        [::]:2181                  [::]:*                   users:(("java",pid=95287,fd=56))
LISTEN     0      50     [::ffff:192.168.60.130]:3888                  [::]:*                   users:(("java",pid=95287,fd=65))
LISTEN     0      50        [::]:8080                  [::]:*                   users:(("java",pid=95287,fd=60))
[root@k8s-node2 zookeeper]#zookeeper集羣部署,配置文件一致,只有在創建myid文件的時候根據配置文件中的server.3=192.168.60.130:2888:3888中的節點id在對應的IP地址主機上這一個區別。
2.1.3、驗證zookeeper集羣
因為在第一個節點(k8s-master)已經創建了topic:“/test2”,在任意節點執行以下命令:
[root@k8s-node2 zookeeper]# ./bin/zkCli.sh -server 127.0.0.1:2181
[zk: 127.0.0.1:2181(CONNECTED) 0] get /test2
Rshine
[zk: 127.0.0.1:2181(CONNECTED) 1]
可以看到在k8s-node2節點上能獲取到topic:/test2的內容,表示集羣部署成功。
2.2、安裝kafka集羣
2.2.1、kafka簡介
1、kafka介紹:
Kafka 是一種高吞吐量的分佈式發佈訂閲消息系統,即使是非常普通的硬件Kafka也可以支持每秒數百萬的消息。採用生產者消費者模型。
2、相關術語:
Broker:Kafka集羣包含一個或多個服務器,這種服務器被稱為broker
Topic:每條發佈到Kafka集羣的消息都有一個類別,這個類別被稱為Topic。(物理上不同Topic的消息分開存儲,邏輯上一個Topic的消息雖然保存於一個或多個broker上但用户只需指定消息的Topic即可生產或消費數據而不必關心數據存於何處)
Partition:Partition是物理上的概念,每個Topic包含一個或多個Partition.
Producer:負責發佈消息到Kafka broker
Consumer:消息消費者,向Kafka broker讀取消息的客户端。
2.2.2、安裝kafka
將kafka的安裝包上傳到所有節點服務器,執行以下操作:
k8s-master:
[root@k8s-master rshine]# ls
apache-zookeeper-3.8.0-bin.tar.gz  filebeat-7.13.1-linux-x86_64.tar.gz  logstash-7.9.2.tar.gz
calico.tar.gz                      kafka_2.13-3.1.0.tgz
[root@k8s-master rshine]# tar -xzf kafka_2.13-3.1.0.tgz -C /usr/local
[root@k8s-master kafka_2.13-3.1.0]# vim config/server.properties
# 修改配置文件中這兩個參數
listeners=PLAINTEXT://192.168.60.128:9092	# 配置當前主機的IP地址
zookeeper.connect=192.168.60.128:2181,192.168.60.129:2181,192.168.60.130:2181	# 把集羣中所有節點的都寫進去

# 啓動kafka
[root@k8s-master kafka_2.13-3.1.0]# ./bin/kafka-server-start.sh -daemon ./config/server.properties
[root@k8s-master kafka_2.13-3.1.0]#
k8s-node1:
[root@k8s-node1 rshine]# ls
apache-zookeeper-3.8.0-bin.tar.gz  filebeat-7.13.1-linux-x86_64.tar.gz  logstash-7.9.2.tar.gz
calico.tar.gz                      kafka_2.13-3.1.0.tgz
[root@k8s-node1 rshine]# tar -xzf kafka_2.13-3.1.0.tgz -C /usr/local
[root@k8s-node1 kafka_2.13-3.1.0]# vim config/server.properties
# 修改配置文件中這兩個參數
listeners=PLAINTEXT://192.168.60.129:9092	# 配置當前主機的IP地址
zookeeper.connect=192.168.60.128:2181,192.168.60.129:2181,192.168.60.130:2181	# 把集羣中所有節點的都寫進去

# 啓動kafka
[root@k8s-node1 kafka_2.13-3.1.0]# ./bin/kafka-server-start.sh -daemon ./config/server.properties
[root@k8s-node1 kafka_2.13-3.1.0]#
k8s-node2:
[root@k8s-node2 rshine]# ls
apache-zookeeper-3.8.0-bin.tar.gz  filebeat-7.13.1-linux-x86_64.tar.gz  logstash-7.9.2.tar.gz
calico.tar.gz                      kafka_2.13-3.1.0.tgz
[root@k8s-node2 rshine]# tar -xzf kafka_2.13-3.1.0.tgz -C /usr/local
[root@k8s-node2 kafka_2.13-3.1.0]# vim config/server.properties
# 修改配置文件中這兩個參數
listeners=PLAINTEXT://192.168.60.130:9092	# 配置當前主機的IP地址
zookeeper.connect=192.168.60.128:2181,192.168.60.129:2181,192.168.60.130:2181	# 把集羣中所有節點的都寫進去

# 啓動kafka
[root@k8s-node2 kafka_2.13-3.1.0]# ./bin/kafka-server-start.sh -daemon ./config/server.properties
[root@k8s-node2 kafka_2.13-3.1.0]#
備註:
zookeeper.connect是指定zookeper集羣地址
listeners=PLAINTEXT://192.168.60.128:9092 這個ip寫的是部署kafka機器的ip
zookeeper在kafka中的作用:管理broker、consumer,創建Broker後,向zookeeper註冊新的broker信息,實現在服務器正常運行下的水平拓展。
kafka集羣的部署,各個節點唯一不同的地方就是配置文件中的broker.id和listeners監聽的主機ip。
2.2.3、驗證kafka集羣
1、登錄zookeeper客户端,查看/brokers/ids
[root@k8s-master kafka_2.13-3.1.0]# /opt/zookeeper/bin/zkCli.sh -server 127.0.0.1:2181
[zk: 127.0.0.1:2181(CONNECTED) 0] ls /brokers/ids
[0, 1, 2]	# 當部署第一個節點時,這裏結果為:[0], 當部署第二個節點時,這裏結果為:[0,1],當部署第三個節點時,這裏結果為:[0,1,2]
[zk: 127.0.0.1:2181(CONNECTED) 1]
可以看到當前kafka有三個節點。
2、生產者和消費者測試
(1)創建主題,主題名是“kafka-test”
[root@k8s-master kafka_2.13-3.1.0]# ./bin/kafka-console-producer.sh --topic kafka-test --bootstrap-server 192.168.60.128:9092
>
(2)查看topic
另起一個終端查看剛創建的topic“kafka-test”
[root@k8s-master kafka_2.13-3.1.0]# cd bin/
[root@k8s-master bin]# ./kafka-topics.sh --describe --topic kafka-test --bootstrap-server 192.168.60.128:9092
OpenJDK 64-Bit Server VM warning: If the number of processors is expected to increase from one, then you should configure the number of parallel GC threads appropriately using -XX:ParallelGCThreads=N
Topic: kafka-test       TopicId: w3Q8cI36Tw6Y--smIJbrZw PartitionCount: 1       ReplicationFactor: 1    Configs: segment.bytes=1073741824
        Topic: kafka-test       Partition: 0    Leader: none    Replicas: 1     Isr: 1
(3)topic寫入消息
[root@k8s-master ~]# cd /usr/local/kafka_2.13-3.1.0/bin/
[root@k8s-master bin]# ./kafka-console-producer.sh --topic kafka --bootstrap-server 192.168.60.128:9092
>my name is god!
>god bless you.
>
(4)打開新的終端,從topic讀取信息
[root@k8s-master kafka_2.13-3.1.0]# cd /usr/local/kafka_2.13-3.1.0/bin/
[root@k8s-master bin]# ./kafka-console-consumer.sh --topic kafka --from-beginning --bootstrap-server 192.168.60.128:9092
[2025-12-23 11:55:57,230] WARN [Consumer clientId=console-consumer, groupId=console-consumer-79184] Error while fetching metadata with correlation id 2 : {kafka=LEADER_NOT_AVAILABLE} (org.apache.kafka.clients.NetworkClient)
[2025-12-23 11:55:57,373] WARN [Consumer clientId=console-consumer, groupId=console-consumer-79184] Error while fetching metadata with correlation id 7 : {kafka=LEADER_NOT_AVAILABLE} (org.apache.kafka.clients.NetworkClient)

my name is god!
god bless you.
當topic在寫入消息時,同時可以從topic讀取到信息。
2.3、部署filebeat服務
filebeat是輕量級的日誌收集組件
在k8s-master上部署filebeat服務,用於收集nginx服務的日誌。並將日誌信息存儲到kafka。
k8s-master:
1、安裝nginx服務
安裝nginx,利用filebeat採集nginx日誌:
[root@k8s-master ~]# yum install nginx -y
[root@k8s-master ~]# systemctl enable nginx --now
# 請求nginx
[root@k8s-master ~]#
[root@k8s-master ~]# curl 192.168.60.128
2、Kafka集羣創建topic,用來存放日誌數據
[root@k8s-master ~]# /usr/local/kafka_2.13-3.1.0/bin/kafka-console-consumer.sh --topic test-topic --from-beginning --bootstrap-server 192.168.60.128:9092, 192.168.60.128:9092, 192.168.60.130:90923、安裝filebeat服務
[root@k8s-master rshine]# tar zxvf filebeat-7.13.1-linux-x86_64.tar.gz -C /usr/local/
[root@k8s-master rshine]# cd /usr/local/filebeat-7.13.1-linux-x86_64/
# 啓用nginx模塊
[root@k8s-master filebeat-7.13.1-linux-x86_64]# ./filebeat modules enable nginx
[root@k8s-master filebeat-7.13.1-linux-x86_64]# vim filebeat_nginx.yml
filebeat.modules:
- module: nginx
  access:
    enabled: true
    var.paths: ["/var/log/nginx/access.log*"]
  error:
    enabled: true
    var.paths: ["/var/log/nginx/error.log*"]
output.kafka:
  enabled: true
  hosts: ["192.168.60.128:9092","192.168.60.129:9092","192.168.60.130:9092"]
  topic: "test-topic"
  required_acks: 1
  compression: gzip
  max_message_bytes: 100000
  codec.format:
    string: '%{[message]}'

# 啓動filebeat
[root@k8s-master filebeat-7.13.1-linux-x86_64]# nohup ./filebeat -e -c filebeat_nginx.yml &
# 請求nginx,通過curl命令或者直接用瀏覽器訪問
[root@k8s-master filebeat-7.13.1-linux-x86_64]# curl 192.168.60.128
#查看kafka topic是否有日誌數據
[root@k8s-master filebeat-7.13.1-linux-x86_64]# cd /usr/local
[root@k8s-master local]# ./kafka_2.13-3.1.0/bin/kafka-console-consumer.sh --topic test-topic --bootstrap-server 192.168.60.128:9092,192.168.60.129:9092,192.168.60.130:9092
OpenJDK 64-Bit Server VM warning: If the number of processors is expected to increase from one, then you should configure the number of parallel GC threads appropriately using -XX:ParallelGCThreads=N
192.168.60.128 - - [23/Dec/2025:12:19:10 +0800] "GET / HTTP/1.1" 200 4833 "-" "curl/7.29.0" "-"
192.168.60.128 - - [23/Dec/2025:12:19:10 +0800] "GET / HTTP/1.1" 200 4833 "-" "curl/7.29.0" "-"
可以看到kafka的topic中已經接收到nginx的日誌信息。
2.4、部署logstash
在zoo2上部署
logstash是日誌收集組件,但是佔用的資源較多,一般都是用來對日誌格式進行轉換
[root@k8s-master local]# wget https://artifacts.elastic.co/downloads/logstash/logstash-7.9.2.tar.gz
[root@k8s-master local]# tar -xzf /home/rshine/logstash-7.9.2.tar.gz -C /usr/local/
[root@k8s-master local]# cd logstash-7.9.2/
[root@k8s-master config]# cp -a logstash-sample.conf logstash.conf
[root@k8s-master config]# vim logstash.conf
# Sample Logstash configuration for creating a simple
# Beats -> Logstash -> Elasticsearch pipeline.

input {
  kafka {
    bootstrap_servers => ["192.168.60.128:9092,192.168.60.129:9092 ,192.168.60.130:9092"]
    auto_offset_reset => "latest"
    consumer_threads => 3
    decorate_events => true
    topics => ["test-topic"]
    codec => "json"
  }
}

output {
  elasticsearch {
    hosts => ["http://192.168.60.128:9200"]
    index => "kafkalog-%{+YYYY.MM.dd}"
    #user => "elastic"
    #password => "changeme"
  }
}
# 啓動
[root@k8s-master config]# cd ../
[root@k8s-master logstash-7.9.2]# ls
bin     CONTRIBUTORS  Gemfile       lib          logs           logstash-core-plugin-api  modules     tools   x-pack
config  data          Gemfile.lock  LICENSE.txt  logstash-core  logstash.log              NOTICE.TXT  vendor
[root@k8s-master logstash-7.9.2]# nohup ./bin/logstash -f ./config/logstash.conf >> logstash.log &
[root@k8s-master local]#
備註:
bootstrap_servers => ["192.168.60.128:9092,192.168.60.129:9092 ,192.168.60.130:9092"]指定kafka集羣地
hosts => ["http://192.168.60.128:9200"]指定es主機地址
2.5、部署es和kibana服務
elasticsearch和kibana都是通過docker容器部署的,所以要先安裝docker。執行以下命令安裝docker:
[root@k8s-master ~]# yum-config-manager --add-repo http://mirrors.aliyun.com/docker-ce/linux/centos/docker-ce.repo
[root@k8s-master ~]# yum install docker-ce -y
[root@k8s-master ~]# systemctl enable docker --now
鏡像加速器這裏不提供。
1、安裝es服務
elasticsearch是一個實時的,分佈式的,可擴展的搜索引擎,它允許進行全文本和結構化搜索以及對日誌進行分析。它通常用於索引和搜索大量日誌數據,也可以用於搜索許多不同種類的文檔。elasticsearch具有三大功能,搜索、分析、存儲數據。
k8s-master:
[root@k8s-master ~]#
[root@k8s-master ~]# cd /usr/local/
[root@k8s-master local]# mkdir es_data
[root@k8s-master local]# chmod 777 /es_data
[root@k8s-master local]# docker run -itd -p 9200:9200 -p 9300:9300 -e "discovery.type=single-node" --name es2 -v /usr/local/es_data:/usr/share/elasticsearch/data elasticsearch:7.9.2
[root@k8s-master local]# docker ps
CONTAINER ID   IMAGE                 COMMAND                  CREATED        STATUS        PORTS                                                                                  NAMES
7bc990def048   elasticsearch:7.9.2   "/tini -- /usr/local…"   22 hours ago   Up 22 hours   0.0.0.0:9200->9200/tcp, :::9200->9200/tcp, 0.0.0.0:9300->9300/tcp, :::9300->9300/tcp   es2
[root@k8s-master local]#
2、安裝kibana服務
kibana是一個基於Web的圖形界面,用於搜索、分析和可視化存儲在Elasticsearch指標中的日誌數據。Kibana功能眾多,在“Visualize” 菜單界面可以將查詢出的數據進行可視化展示,“Dev Tools” 菜單界面可以讓户方便地通過瀏覽器直接與 Elasticsearch 進行交互,發送 RESTFUL對 Elasticsearch 數據進行增刪改查。。它操作簡單,基於瀏覽器的用户界面可以快速創建儀表板(dashboard)實時顯示Elasticsearch查詢動態。設置Kibana非常簡單。無需編碼或者額外的基礎架構,幾分鐘內就可以完成Kibana安裝並啓動Elasticsearch索引監測。
k8s-master:
docker run -itd --name kibana -p 5601:5601 --link es2 -e ELASTICSEARCH_URL=http://192.168.60.128:9200 kibana:7.9.2
[root@k8s-master local]# docker exec -it kibana /bin/bash
bash-4.2$
bash-4.2$ cat config/kibana.yml
#
# ** THIS IS AN AUTO-GENERATED FILE **
#

# Default Kibana configuration for docker target
server.name: kibana
server.host: "0"
elasticsearch.hosts: [ "http://192.168.60.128:9200" ]
monitoring.ui.container.elasticsearch.enabled: true
bash-4.2$ exit
exit
[root@k8s-master local]# docker restart kibana通過訪問宿主機的5601端口,就可以訪問kibana了。http://192.168.60.128:5601
2.6 配置kibana ui界面
訪問http://192.168.60.128:5601打開kibana圖形界面。
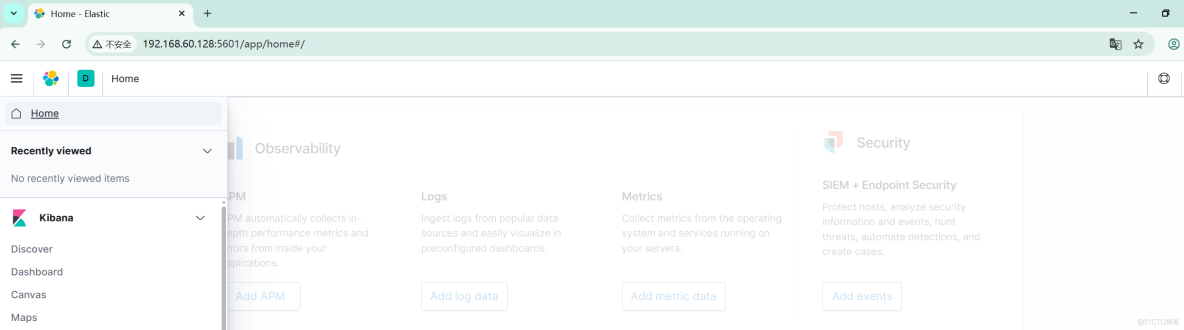
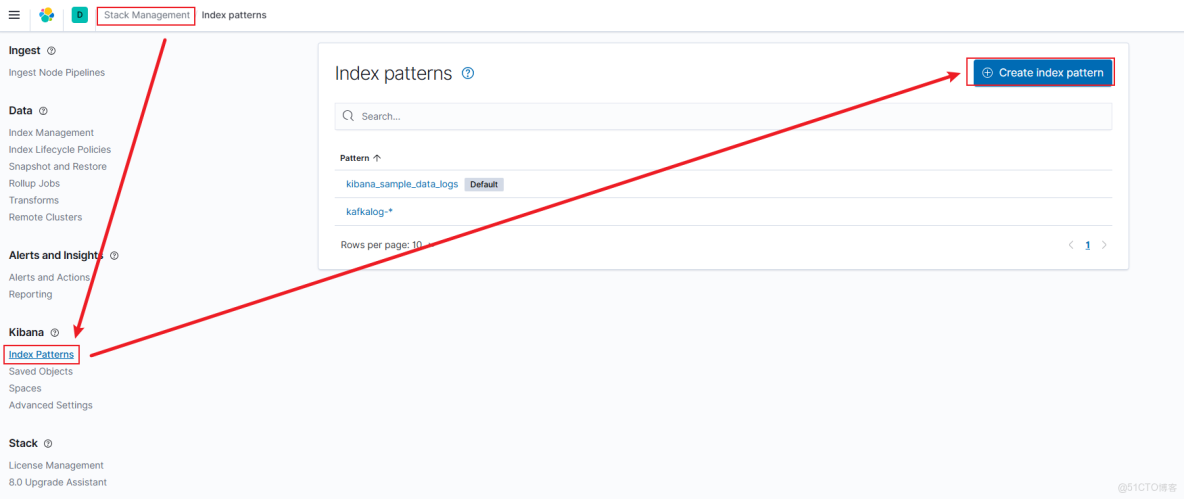
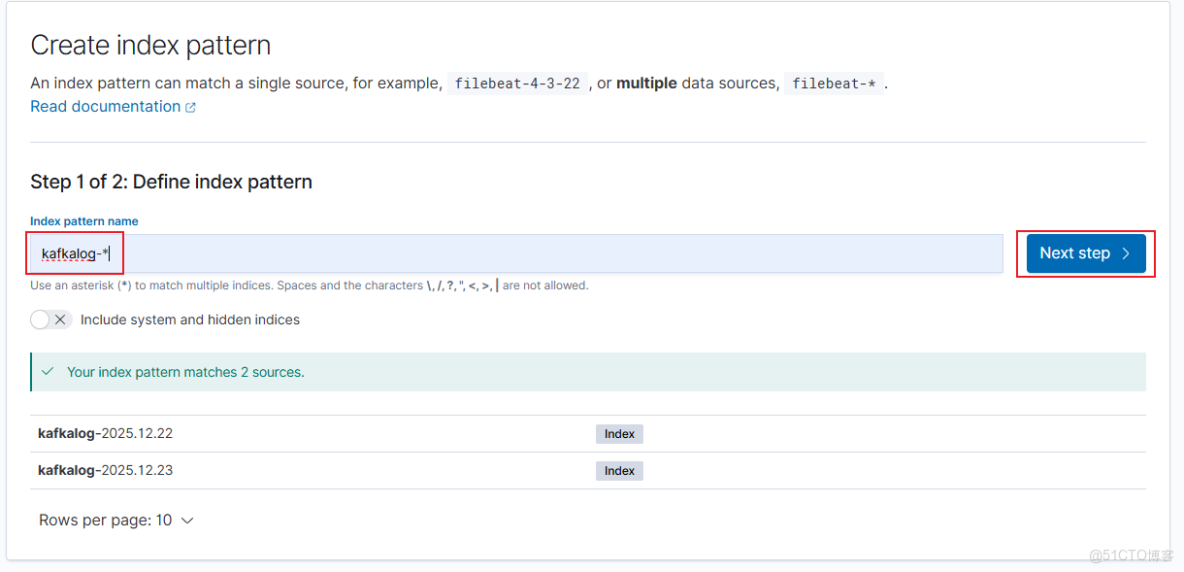
Kibana添加索引
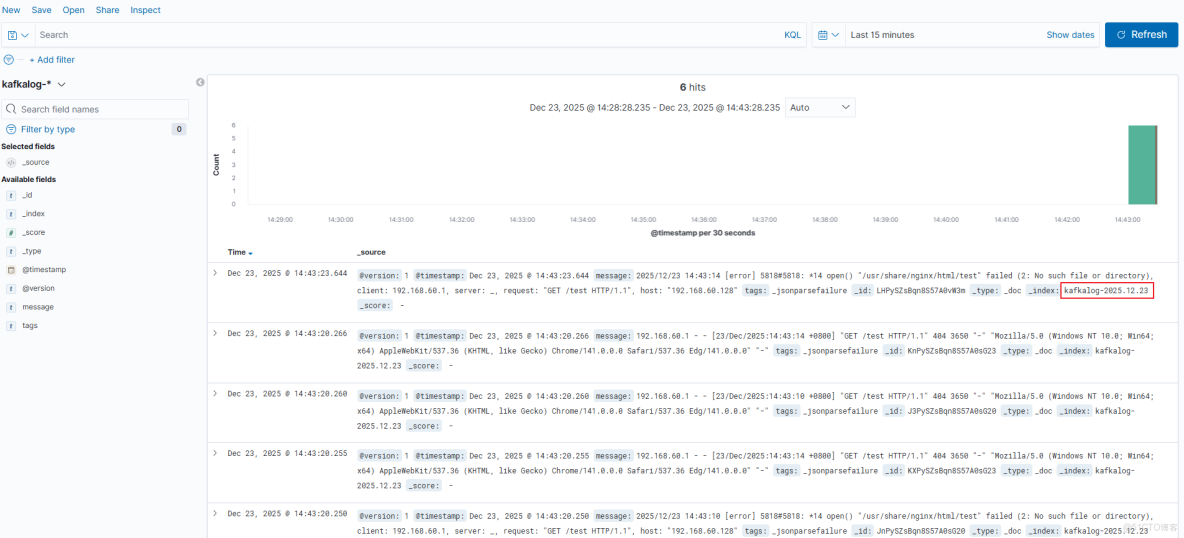
輸入logstash配置的index,可以看到匹配到了對應的日誌內容。
選擇timestamp
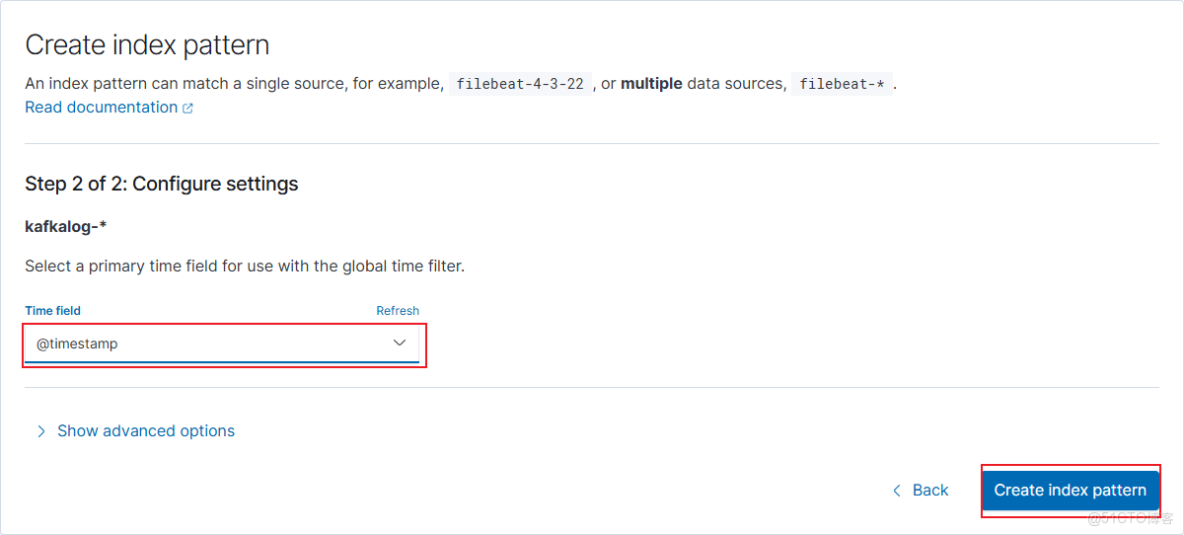
需要再次curl訪問nginx,才會產生數據。
回到kibana首頁,點擊Discover查看日誌: