

做 A/B 測試或者分析轉化率的時候,經常會碰到那個老生常談的問題:
“這數據的波動到底是干預引起的,還是僅僅是相關性?”
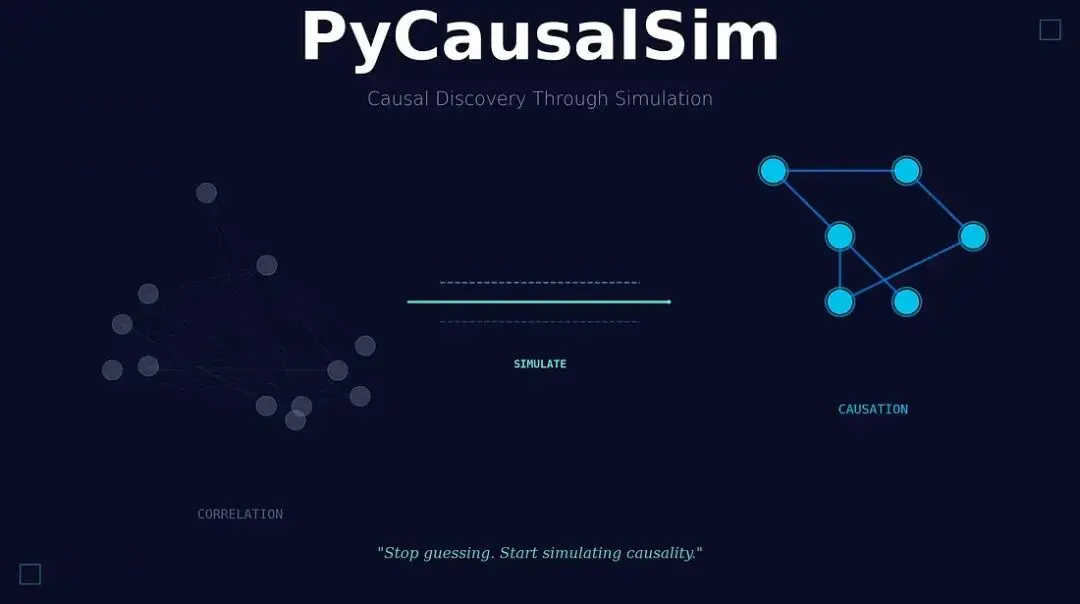
傳統的分析手段和機器學習擅長告訴你什麼能預測結果,但預測不等於因果。而在做決策,不管是干預、優化還是調整業務邏輯時,我們需要的是因果關係。
今天介紹一下 PyCausalSim,這是一個利用模擬方法來挖掘和驗證數據中因果關係的 Python 框架。
問題:相關性好找,因果難定
舉個例子,減少頁面加載時間後轉化率漲了,看起來是沒問題的。但這真的是加載速度的功勞嗎?也許同期正好上了新的營銷活動,或者是季節性效應,甚至僅僅是競爭對手掛了,又或者只是隨機噪聲。這時候傳統方法往往會失效:
 # WRONG: This doesn't tell you what CAUSES conversions
 from sklearn.ensemble import RandomForestRegressor

 rf = RandomForestRegressor()
 rf.fit(X, y)
 print(rf.feature_importances_)  # Tells you what predicts, NOT what causes
Feature importance 只能告訴你什麼能預測結果,它搞不定混淆變量(confounders),分不清因果方向,在遇到選擇偏差(selection bias)時也會翻車,因為它給出的僅僅是相關性。
PyCausalSim
PyCausalSim 走的是另一條路。它不光是找數據模式,而是:學習系統的因果結構,模擬反事實場景(Counterfactuals,即“如果……會發生什麼”),然後通過嚴格的統計檢驗驗證因果假設。他的工作流程大致如下:
 from pycausalsim import CausalSimulator

 # Initialize with your data
 simulator = CausalSimulator(
     data=df,
     target='conversion_rate',
     treatment_vars=['page_load_time', 'price', 'design_variant'],
     confounders=['traffic_source', 'device_type']
 )

 # Discover causal structure
 simulator.discover_graph(method='ges')

 # Simulate: What if we reduce load time to 2 seconds?
 effect = simulator.simulate_intervention('page_load_time', 2.0)
 print(effect.summary())
輸出
  Causal Effect Summary
 ==================================================
 Intervention: page_load_time = 2.0
 Original value: 3.71
 Target variable: conversion_rate

 Effect on conversion_rate: +2.3%
 95% CI: [+1.8%, +2.8%]
 P-value: 0.001
這是真正的因果效應估計,不再是簡單的相關性分析。
核心因果模擬器 (Core Causal Simulator)
CausalSimulator類是整個框架的核心。它負責圖發現(從數據中自動學習因果結構)、干預模擬(蒙特卡洛模擬反事實結果)、驅動因素排序、策略優化以及內置的驗證模塊(敏感性分析、安慰劑檢驗等)。
 # Rank true causal drivers
 drivers = simulator.rank_drivers()
 for var, effect in drivers:
     print(f"{var}: {effect:+.3f}")

 # Output:
 # page_load_time: +0.150
 # price: -0.120
 # design_variant: +0.030
營銷歸因 (Marketing Attribution)
別再只看 Last-touch 歸因了,瞭解每個渠道的真實增量價值才是最重要的:
 from pycausalsim import MarketingAttribution

 attr = MarketingAttribution(
     data=touchpoint_data,
     conversion_col='converted',
     touchpoint_cols=['email', 'display', 'search', 'social', 'direct']
 )

 # Causal Shapley values for fair attribution
 attr.fit(method='shapley')
 weights = attr.get_attribution()
 # {'search': 0.35, 'email': 0.25, 'social': 0.20, 'display': 0.15, 'direct': 0.05}

 # Optimize budget allocation
 optimal = attr.optimize_budget(total_budget=100000)
支持的方法包括 Shapley 值(博弈論)、馬爾可夫鏈歸因、Uplift 歸因、邏輯迴歸以及傳統的首末次接觸基線。
A/B 測試分析 (A/B Test Analysis)
實驗分析不能只靠 t-test,引入因果推斷能做得更深:
 from pycausalsim import ExperimentAnalysis

 exp = ExperimentAnalysis(
     data=ab_test_data,
     treatment='new_feature',
     outcome='engagement',
     covariates=['user_tenure', 'activity_level']
 )

 # Doubly robust estimation (consistent if EITHER model is correct)
 effect = exp.estimate_effect(method='dr')
 print(f"Effect: {effect.estimate:.4f} (p={effect.p_value:.4f})")

 # Analyze heterogeneous effects
 het = exp.analyze_heterogeneity(covariates=['user_tenure'])
 # Who responds differently to the treatment?
支持簡單均值差分、OLS 協變量調整、IPW(逆概率加權)、雙重穩健(Doubly Robust / AIPW)以及傾向性評分匹配。
Uplift 建模
關注點在於誰會對干預產生反應,而不只是平均效應。
 from pycausalsim.uplift import UpliftModeler

 uplift = UpliftModeler(
     data=campaign_data,
     treatment='received_offer',
     outcome='purchased',
     features=['recency', 'frequency', 'monetary']
 )

 uplift.fit(method='two_model')

 # Segment users by predicted response
 segments = uplift.segment_by_effect()
用户分層非常直觀:
- Persuadables — 只有被幹預才轉化。這是核心目標。
- Sure Things — 不干預也會轉化。別在這浪費預算。
- Lost Causes — 干預了也沒用。
- Sleeping Dogs — 干預反而起反作用。絕對要避開。
結構因果模型 (Structural Causal Models)
如果你對系統機制有明確的先驗知識,還可以構建顯式的因果模型:
 from pycausalsim.models import StructuralCausalModel

 # Define causal graph
 graph = {
     'revenue': ['demand', 'price'],
     'demand': ['price', 'advertising'],
     'price': [],
     'advertising': []
 }

 scm = StructuralCausalModel(graph=graph)
 scm.fit(data)

 # Generate counterfactuals
 cf = scm.counterfactual(
     intervention={'advertising': 80},
     data=current_data
 )

 # Compute average treatment effect
 ate = scm.ate(
     treatment='price',
     outcome='revenue',
     treatment_value=27,
     control_value=30
 )
多種發現算法
PyCausalSim 集成了多種算法來學習因果結構,適應不同場景:
- PC (Constraint-based) — 通用,可解釋性強。
- GES (Score-based) — 搜索效率高,默認效果不錯。
- LiNGAM (Functional) — 處理非高斯數據效果好。
- NOTEARS (Neural) — 神經網絡方法,能處理複雜關係。
- Hybrid (Ensemble) — 通過多種方法的共識來提高穩健性。
 # Try different methods
 simulator.discover_graph(method='pc')      # Constraint-based
 simulator.discover_graph(method='ges')     # Score-based
 simulator.discover_graph(method='notears') # Neural
 simulator.discover_graph(method='hybrid')  # Ensemble
內置驗證
任何因果結論都得經得起推敲。PyCausalSim 內置了驗證模塊:
 sensitivity = simulator.validate(variable='page_load_time')

 print(sensitivity.summary())
 # - Confounding bounds at different strengths
 # - Placebo test results
 # - Refutation test results
 # - Robustness value (how much confounding would nullify the effect?)
安裝
直接從 GitHub 安裝:
pip install git+[https://github.com/Bodhi8/pycausalsim.git](https://github.com/Bodhi8/pycausalsim.git)或者 clone 到本地:
 git clone [https://github.com/Bodhi8/pycausalsim.git](https://github.com/Bodhi8/pycausalsim.git)
 cd pycausalsim
 pip install -e".[dev]"
依賴庫包括 numpy, pandas, scipy, scikit-learn (核心),可視化用到 matplotlib 和 networkx。也可選集成 dowhy 和 econml。
總結
PyCausalSim 的構建基於數十年的因果推斷研究成果:Pearl 的因果框架(結構因果模型、do-calculus)、Rubin 的潛在結果模型,以及現代機器學習方法(NOTEARS, DAG-GNN)和蒙特卡洛模擬。並且它與 DoWhy (Microsoft), EconML (Microsoft) 和 CausalML (Uber) 等生態系統兼容。
機器學習問“會發生什麼”,因果推斷問“為什麼發生”,而PyCausalSim解決的是“如果……會發生什麼”。
地址:
https://avoid.overfit.cn/post/8c1d8e45c56e47bfb49832596e46ecf6
作者:Brian Curry