1. 概述
在本文中,我們將向我們的 Spring Cloud 項目添加 Zipkin。 Zipkin 是一個開源項目,它提供用於發送、接收、存儲和可視化跟蹤的機制。 這使我們能夠關聯服務器之間的活動,並獲得對我們服務中正在發生的事情的更清晰的瞭解。本文檔不是關於分佈式跟蹤或 Spring Cloud 的入門介紹。 如果您想了解更多關於分佈式跟蹤的信息,請閲讀我們關於 Spring Sleuth 的介紹。
注意: Zipkin 項目已棄用自定義服務器。 無法運行與 Spring Cloud 或 Spring Boot 兼容的自定義 Zipkin 服務器。 運行 Zipkin 服務器的最佳方法是在 Docker 容器中。
在第 2 節中,我們將描述如何為自定義服務器構建設置 Zipkin。
在第 3 節中,我們將描述首選的默認服務器構建、設置、服務配置和運行過程。
2. 自定義構建的 Zipkin 服務
我們的 Zipkin 服務將作為所有 span 的存儲庫。每個 span 都被髮送到該服務並收集成軌跡,以便於未來的識別。
2.1. 環境搭建
我們創建一個新的 Spring Boot 項目,並將以下依賴添加到 pom.xml 中:
<dependency>
    <groupId>io.zipkin.java</groupId>
    <artifactId>zipkin-server</artifactId>
</dependency>
<dependency>
    <groupId>io.zipkin.java</groupId>
    <artifactId>zipkin-autoconfigure-ui</artifactId>
    <scope>runtime</scope>
</dependency>
作為參考:最新版本可在 Maven Central (zipkin-server, zipkin-autoconfigure-ui) 找到。依賴的版本繼承自 spring-boot-starter-parent。
2.2. 啓用 Zipkin 服務器
為了啓用 Zipkin 服務器,我們需要向主應用程序類添加一些註解:
@SpringBootApplication
@EnableZipkinServer
public class ZipkinApplication {...}
新的註解 將設置此服務器監聽傳入的 span,並作為我們查詢的 UI。
2.3. 配置
首先,在 src/main/resources 目錄下創建一個名為 bootstrap.properties 的文件。請注意,該文件用於從配置服務器獲取我們的配置。
接下來,添加以下配置屬性:
spring.cloud.config.name=zipkin
spring.cloud.config.discovery.service-id=config
spring.cloud.config.discovery.enabled=true
spring.cloud.config.username=configUser
spring.cloud.config.password=configPassword

eureka.client.serviceUrl.defaultZone=
  http://discUser:discPassword@localhost:8082/eureka/
現在讓我們為我們的配置倉庫添加一個配置文件,該配置文件位於 Windows 上的 c:\Users{username}</em > 或 *nix 系統的 /home/{username}/。
在目錄中,讓我們添加一個名為 zipkin.properties 的文件並添加以下內容:
spring.application.name=zipkin
server.port=9411
eureka.client.region=default
eureka.client.registryFetchIntervalSeconds=5
logging.level.org.springframework.web=debug
請務必提交此目錄中的更改,以便配置服務檢測到更改並加載文件。
2.4. 運行
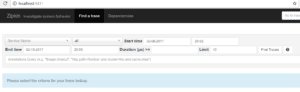
現在讓我們運行我們的應用程序,並導航到 http://localhost:9411。 我們應該看到 Zipkin 的主頁:
太好了!現在我們準備好添加一些依賴項和配置到我們想要跟蹤的服務中。
2.5. 服務配置
資源服務器的設置非常簡單。在後續章節中,我們將詳細介紹如何設置 book-service。之後,我們可以將其配置為 rating-service 和 gateway-service。
2.5.1. 設置
為了開始向我們的 Zipkin 服務器發送 span,我們將添加以下依賴項到我們的 pom.xml 文件中:
<dependency>
    <groupId>org.springframework.boot</groupId>
    <artifactId>spring-boot-starter-actuator</artifactId>
</dependency>
<dependency>
    <groupId>io.zipkin.reporter2</groupId>
    <artifactId>zipkin-reporter-brave</artifactId>
</dependency>
<dependency>
    <groupId>io.micrometer</groupId>
    <artifactId>micrometer-tracing-bridge-brave</artifactId>
</dependency>
2.5.3. 配置
現在,讓我們為我們的 book-service.properties 文件在配置倉庫中添加一些配置:
management.tracing.sampling.probability=1Zipkin 通過對服務器上發生的動作進行採樣來工作。通過將 management.tracing.sampling.probability 設置為 1,我們將採樣率設置為 100%。
3. 使用默認服務器構建進行配置
如前所述,這是運行 Zipkin 的推薦方法。
3.1. Zipkin 模塊設置
在您的 IDE 項目中,創建一個名為“Zipkin”的文件夾,並添加一個包含以下內容的 <docker-compose.yml> 文件:
version: "3.9"
  <br> services:
  <br> zipkin:
  <br> image: openzipkin/zipkin
  <br> ports:
  <br> - 9411:9411</code></p>
或者,您可以查閲官方文檔 這裏。
3.2. 服務配置
服務配置與 2.5 節中的內容相同。
3.3. 運行
首先,啓動 Redis 服務器,同時使用 <em >docker compose up -d</em > 命令啓動config、<em >discovery</em >、gateway、<em >book</em >、rating 和 <em >Zipkin</em > 鏡像。 然後,導航到 <em >http://localhost:8080/book-service/books</em > 地址。 之後,在新標籤頁中導航到http://localhost:9411 地址。 在該頁面上,選擇 `book-service 並點擊“查找跟蹤”按鈕。 我們應該能在搜索結果中看到跟蹤出現。 最後,可以點擊該跟蹤以打開它。
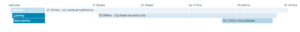
在跟蹤頁面上,我們可以看到請求按服務分解。 前兩個 span 由 <em >gateway</em > 創建,最後一個 span 由book-service 創建。 這表明請求在 <em >book-service</em > 上花費了 18.379 毫秒,在gateway 上花費了 87.961 毫秒。
4. 結論
我們已經看到如何輕鬆地將 Zipkin 集成到我們的雲應用程序中。
這使我們能夠獲得關於通信在應用程序中傳輸方式的寶貴見解。 隨着應用程序的複雜性增加,Zipkin 可以為我們提供關於請求花費時間的必要信息。 這可以幫助我們確定哪些地方正在變慢,並指示哪些方面需要改進。
